Growth Teams: Track App Price Changes From Snapshots to Alerts

The fastest way to track app price changes is a small, repeatable pipeline: daily or weekly snapshots of competitor storefronts, automated alerts on price deltas, and a fast test to confirm the signal before you react. Start today by adding your top three competitors to a snapshot routine, whether that’s a spreadsheet or a watchlist inside a tool like Apppricer. Watch price alongside conversion and ARPU, not in isolation.
TL;DR:
- Tracking multiple app store fields beyond just price, such as in-app purchases and paywall details, reveals independent price layer movements that impact revenue.
- Automated pipelines for scraping and alerts are scalable for over five apps but require proper cadence, context-rich alerts, and clear ownership to be effective.
- Price changes under 5% typically warrant no action, while those over 20% or involving new tiers should prompt direct responses or testing strategies.
- Using platforms like Apppricer simplifies ongoing monitoring by providing historical data, regional pricing, and trend analysis without custom scraping infrastructure.
Table of Contents
- What App Store Fields and Metrics Should You Actually Track?
- How Do You Start Tracking Prices Manually, Today?
- How Do You Automate App Price Tracking and Alerts?
- When Should You Ignore, Investigate, Match, or Test a Price Signal?
- What Does This Look Like in Practice?
- What Cadence and Ownership Actually Make This Stick?
- Track App Price Changes Automatically With Apppricer
- Sources
- FAQ
What App Store Fields and Metrics Should You Actually Track?
Tracking a single “price” number tells you almost nothing. Apps monetize through layered structures, and each layer can move independently.
Pull these fields for every competitor product page:
- List price and formattedPrice — the display price and currency-formatted version App Store returns per region
- inAppPurchases array — includes each purchase’s name, price, and duration (weekly, monthly, annual)
- Trial length and paywall preselect — which tier loads by default, since that’s usually the one the developer wants you to pick
- Currency and country code — critical because a price cut in one region can just be a currency adjustment
Currency matters more than most teams assume. A developer in Turkey or Argentina might raise local prices constantly just to keep pace with inflation, while the dollar-denominated price looks flat. Normalize for purchasing power before you call something a real strategic move.
None of this means anything without pairing it to your own funnel. Track trial-start rate, trial-to-paid conversion, retention curves, ARPU, and LTV alongside every price snapshot. Subscriptions deliver predictable revenue precisely because they reward developers who manage churn well, so a competitor’s price move often signals a retention problem before it signals a pricing strategy.
How Do You Start Tracking Prices Manually, Today?
You don’t need a data pipeline to start. You need a folder and thirty minutes a week.
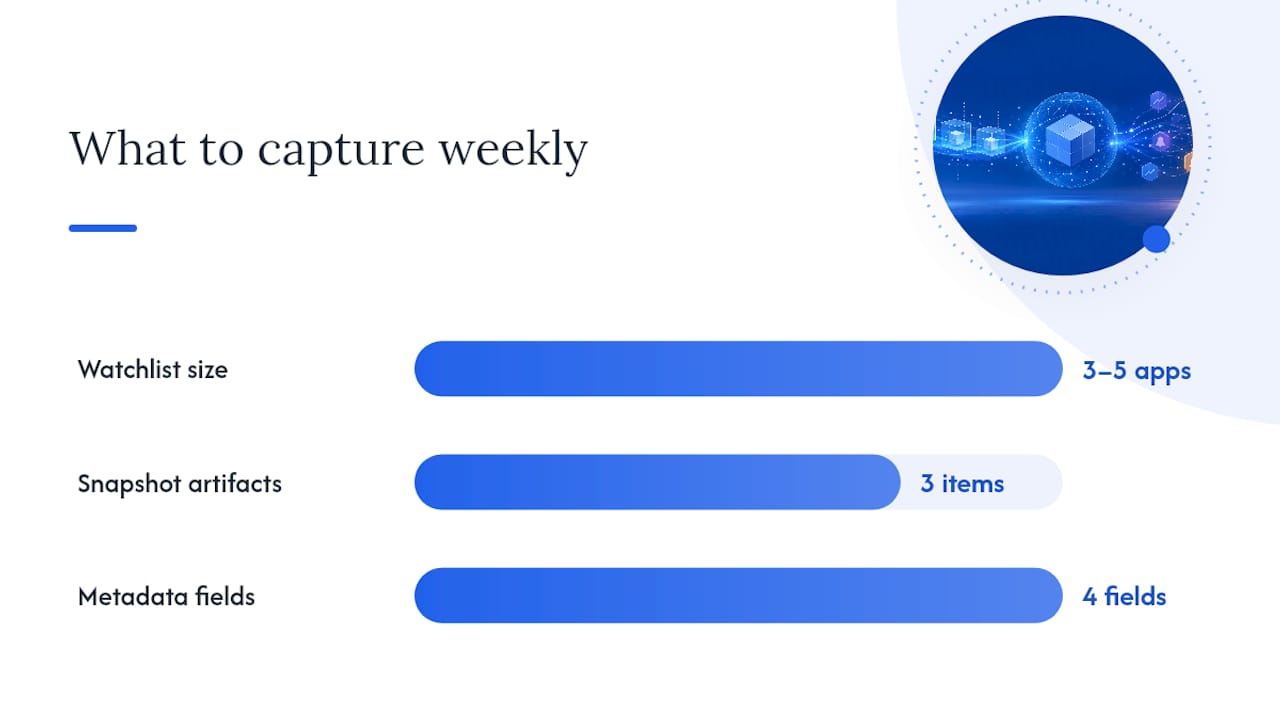
- Pick your watchlist. Three to five direct competitors, plus two aspirational apps priced higher than you.
- Take a full snapshot. Screenshot the product page, copy the in-app purchases list, and screenshot the paywall as it first loads.
- Save structured metadata with every snapshot. At minimum: appId, region, timestamp, and formattedPrice. A simple table with columns for appId, region, item, price, and timestamp works fine in a spreadsheet.
- Compare against last week’s snapshot. Flag anything that moved.
- Write a one-line hypothesis for every change. Something like: “Competitor X raised its annual tier 20% after adding a new feature, testing willingness to pay.” Then name the cheapest way to check it, often just watching their app store reviews for price complaints.
Subscribing to a competitor’s own app reveals tiers you’d never see on the public paywall. Checking your App Store subscriptions page after subscribing surfaces legacy pricing and grandfather tiers that only exist for previously acquired users, a detail most competitive analyses miss entirely.
Dated folders (by week, by app) beat a single running document. You’ll thank yourself in six months when you need to trace exactly when a price moved.
Pro Tip: Keep a “hypothesis” column next to every logged price change. Six months later, you’ll have a track record of which guesses were right, and that pattern is often more valuable than the price data itself.
How Do You Automate App Price Tracking and Alerts?
Manual tracking works for five apps. It falls apart at fifty. Once your watchlist grows, you need a pipeline: ingest, normalize, store, compare, alert.
Ingestion typically comes from scraping App Store product pages and localized storefronts. One practitioner’s setup for automatically monitoring iOS competitor pricing pulls a JSON array of in-app purchases containing name, price, and duration for each region, which becomes the raw material for every downstream comparison. Some teams use proxy rotation to fetch region-specific pages reliably, since App Store often geo-locates by request origin rather than a simple query parameter.
Scheduling is a cost versus freshness trade-off:
- Daily pulls for your top three to five direct competitors
- Weekly pulls for a broader category sample of 20 to 50 apps
- Monthly spot checks for aspirational or adjacent apps outside your immediate competitive set
Daily scraping across 175 countries for dozens of apps adds up in compute and proxy costs fast, so most teams scale cadence to how much a given competitor’s move would actually change their roadmap.
Alert payloads need to carry enough context to act on immediately. A well-built alert format includes:
- Old price and new price
- Percent change
- Region and currency
- Specific item or tier affected
- A suggested next action (investigate, ignore, or test)
A properly built alert that fires within hours instead of weeks turns a price change into an experiment you can launch the same week, not a retroactive Q3 analysis nobody reads.
When Should You Ignore, Investigate, Match, or Test a Price Signal?
Not every price change deserves a reaction. Most don’t.
Before deciding anything, check three things: recent release notes (a price bump often follows a feature launch), seasonality (Black Friday and back-to-school pricing swings reverse within weeks), and whether the change is region-specific or global.
- Under 5% change: log it, move on. This is normal currency drift or rounding noise.
- 5% to 20% change: investigate. Check if it’s tied to a feature release, a new market entry, or a broader category shift. Look at whether competitors are moving in the same direction.
- Over 20% change, or a new tier appears: act. This is a deliberate strategic move worth a direct response, whether that’s matching, differentiating, or running your own test.
When you do act, sequence your experiments. Testing price before duration or visuals keeps results interpretable, since running three changes at once makes it impossible to know which one moved the needle.
Give any pricing test enough runway to reach statistical confidence, generally a few weeks minimum depending on your traffic volume, and measure MRR lift, ARPU shift, and churn together rather than any single metric alone. A price increase that lifts ARPU but spikes churn within the first month is not a win; it’s a trade you haven’t finished evaluating yet.
Pro Tip: Run the pricing test before you touch paywall visuals or copy. If you change all three at once, you’ll never know which one actually earned the lift.

What Does This Look Like in Practice?
Here’s a scenario built from the same workflow described above: a growth team notices, through a timestamped ledger, that a leading competitor quietly dropped its annual subscription price by 20% right before its typical fiscal year end. The date, region, old price, and new price all sit in one row of the ledger, which is what makes the pattern visible instead of anecdotal.
That single logged row triggered a prioritized pricing test within the week, instead of a debate about whether the drop was even real.
A single dated row in a price ledger, cross-referenced against release notes and seasonality, is often the difference between reacting to a rumor and reacting to a fact.
This is the exact gap Apppricer was built to close. Apppricer aggregates app pricing and subscription data across 175 countries, giving teams:
- Per-country pricing snapshots without manual scraping
- Subscription tier and trial-length aggregation across regions
- Revenue and download trend estimates tied to pricing moves
- A historical ledger instead of a single point-in-time screenshot
Author Sergey has spent years studying app monetization patterns across global markets, with a focus on how subscription pricing shifts correlate with revenue and retention outcomes, the same lens this article applies throughout.
What Cadence and Ownership Actually Make This Stick?
A tracking habit dies the moment it depends on someone remembering to check manually. Build it into a cadence instead.
Run daily automated alerts for your top three competitors, a weekly digest covering your broader category sample, and a quarterly strategic review where the team steps back from individual deltas and asks what the market is doing overall. Reviewing pricing metrics quarterly and running at least one structured pricing test per year is a reasonable baseline cadence for most subscription apps.
Assign ownership clearly: one person or team owns the pipeline and alert quality, growth or product owns designing and running the resulting experiments, and whoever handles external comms owns translating a competitor’s move into a response, if one is warranted at all. Fold price monitoring into sprint planning as a recurring line item, not a fire drill, and tie at least one OKR each quarter to a pricing hypothesis you tested and measured. Teams building this kind of ongoing competitive intelligence practice often borrow structure from broader competitor analysis frameworks built for marketing teams, since the discipline of documenting hypotheses transfers directly.
Track App Price Changes Automatically With Apppricer
Building your own scraper, proxy rotation, and alert pipeline is a real engineering project, not a weekend script. Apppricer exists so you don’t have to build that infrastructure yourself.
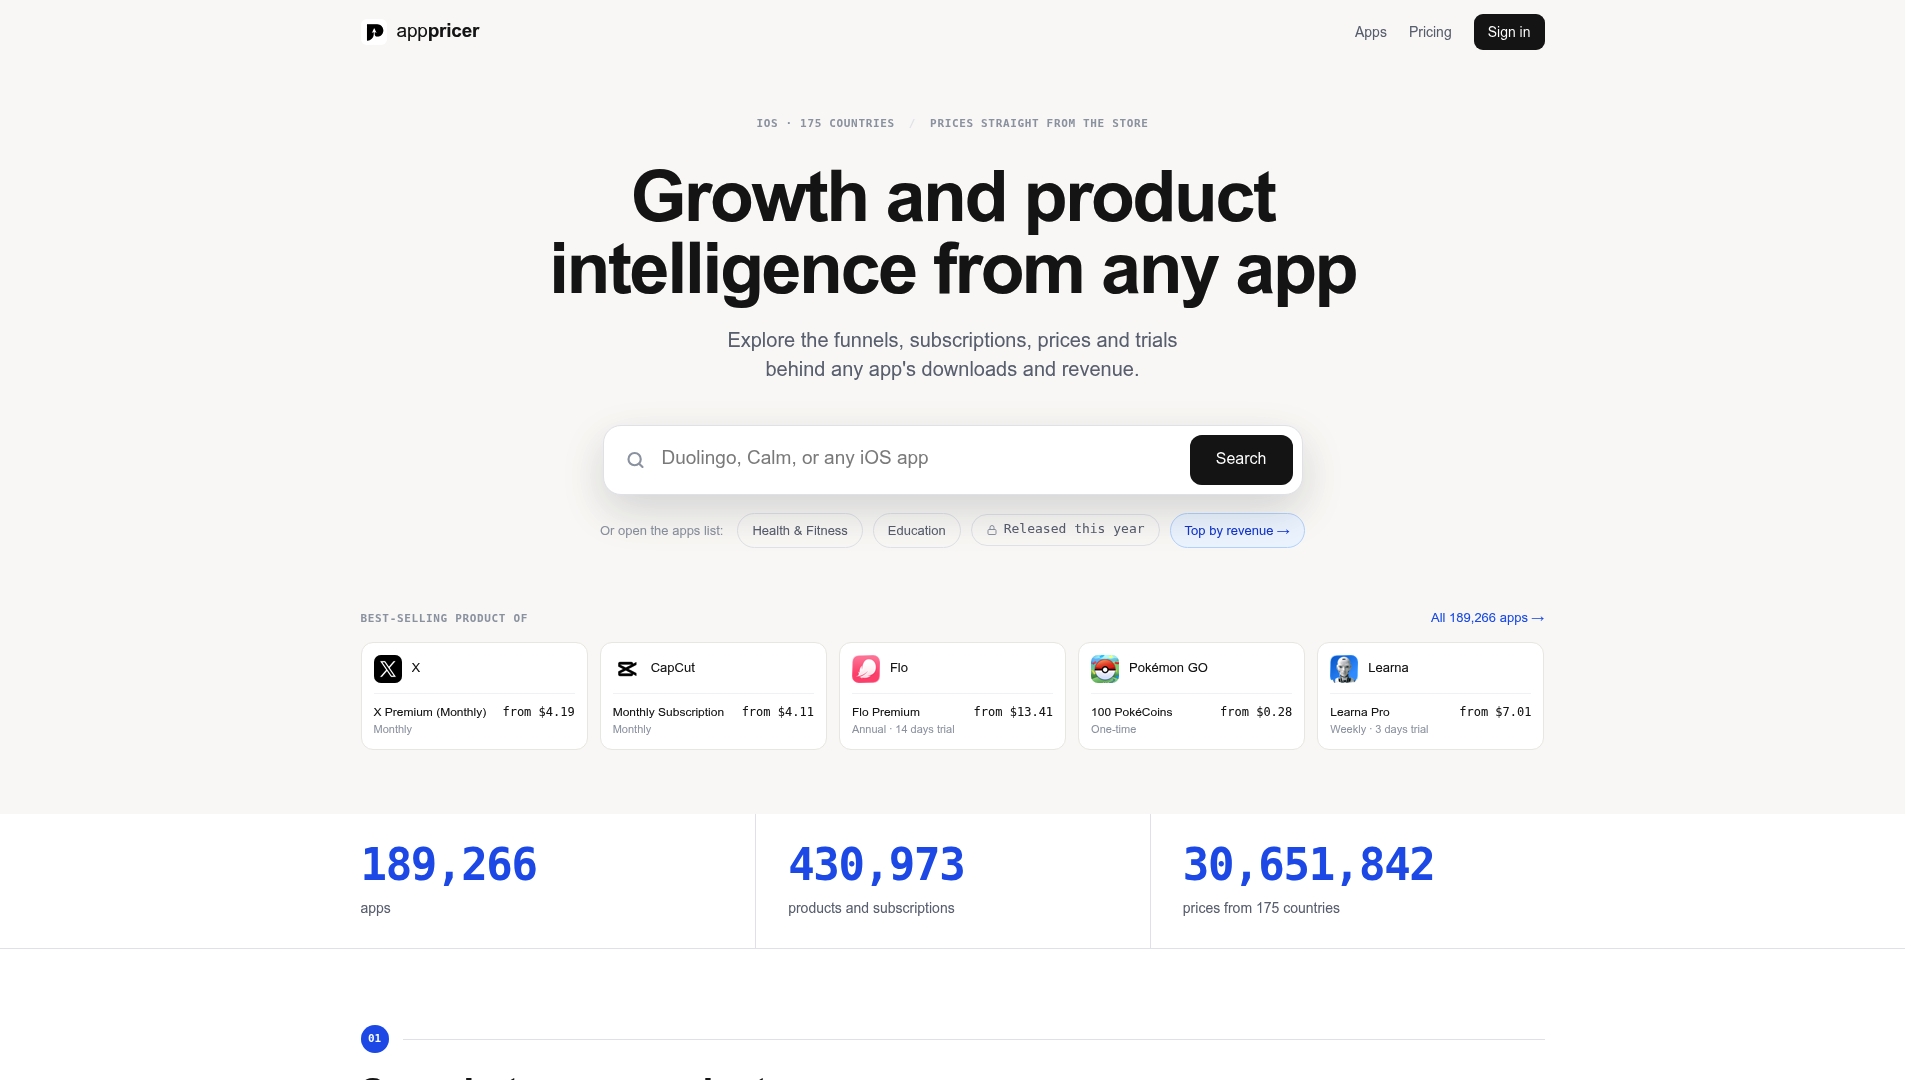
Certain platforms aggregate live pricing, subscription tiers, trial structures, and revenue and download trends for apps across many countries, providing exact product and geo-specific pricing instead of estimates or sample sets. These solutions can include competitor A/B test outcomes and real pricing history without requiring users to maintain scrapers, manage proxies, or write custom alert logic. For a growth or product team, the buyer’s job here is straightforward: replace guesswork with a historical ledger you can query, and get alerted the moment a competitor’s tier structure changes so your team can test a response instead of discovering the shift a quarter late.
If you’re ready to move from manual snapshots to an automated pipeline, check the Apppricer Pro plan for full access to pricing, revenue, and download analytics.
Sources
- Appsflyer — App pricing strategies
- DEV Community — How I monitor my iOS competitors’ pricing changes automatically
FAQ
What Data Should You Capture to Track App Price Changes?
Capture list price, the full inAppPurchases array (name, price, duration), formattedPrice, currency, trial length, and which paywall tier is preselected, per region and per timestamp.
How Often Should You Check Competitor App Prices?
Check your top three to five competitors daily and run a broader category sample weekly, with a quarterly strategic review of pricing trends overall.
Is It Legal to Track Competitor App Pricing?
Yes. Public App Store pricing and listing data is publicly visible information, though scraping at scale should respect Apple’s terms of service and rate limits rather than hammering endpoints aggressively.
What Counts as a Meaningful Price Change Worth Acting On?
Changes under 5% are usually noise, 5% to 20% warrants investigation, and anything over 20%, or a new subscription tier appearing, usually justifies a direct response or test.
Can a Tool Automate This Instead of Manual Tracking?
Yes. Platforms like Apppricer aggregate pricing, subscription, and revenue data across 175 countries so teams don’t have to build their own scraping and alert infrastructure.