The Real Reasons Subscribers Cancel and How to Stop It

The subscribers who cancel almost always fall into six buckets: they don’t see the value anymore, they’ve stopped using the product, their card failed, something in the product frustrated them, they can’t pause or downgrade instead of quitting, or support let them down. Aggregated surveys put cost and perceived value at the top, with roughly 63% of subscribers naming price as their stated reason, while involuntary churn from failed payments accounts for 20 to 40 percent of total churn across subscription businesses.
Do three things in the next 72 hours:
- Add a one-question cancel survey with a pause option built into the flow itself, not an afterthought after the cancellation is confirmed.
- Run a payments health check. Pull your failed-payment rate and expired-card count today.
- Segment your low-usage accounts and queue them for a targeted activation nudge before they hit the cancel button.
Pro Tip: Assign each of these three actions to a named owner with a 7-day deadline. Vague “the team will look into it” tasks die in backlog purgatory.
- Owner for cancel-flow survey and pause logic
- Owner for payments/dunning audit
- Owner for low-usage activation campaign
Key Takeaways
Most subscription cancellations trace back to a handful of fixable causes, and involuntary churn from failed payments alone accounts for up to 40 percent of total churn that dunning sequences can recover.
| Point | Details |
|---|---|
| Cost and value lead | Price and perceived value drive roughly 63% of stated cancellations across cross-industry surveys. |
| Involuntary churn is fixable | Failed payments cause 20 to 40% of total churn, much of it recoverable with retry logic and card-update prompts. |
| Stated reasons mislead | Exit-survey answers match the real driver less than 27% of the time, so triangulate with behavior data. |
| Match offers to reasons | Pause for low usage, downgrade for price sensitivity, and card updates for billing failures outperform blanket discounts. |
| Use market data for pricing calls | Apppricer’s cross-market pricing and revenue data helps confirm whether a price change, not the product, triggered a churn spike. |
Table of Contents
- What Are the Most Common Subscription Cancellation Reasons?
- Do Cancellation Reasons Differ by Product Type and Plan?
- How Do You Collect Cancellation Reasons Without Bias?
- Which Retention Tactics Fix Which Cancellation Reason?
- What Metrics Prove Your Retention Fixes Are Working?
- Can App Pricing Data Reveal Hidden Price-Driven Churn?
- When Resources Are Tight, Where Should You Focus First?
- How Apppricer Helps You Test Pricing-Driven Churn Theories
- Frequently Asked Questions
- Sources
What Are the Most Common Subscription Cancellation Reasons?
Every cancellation reason leaves fingerprints in your data before the customer ever clicks “cancel.” Knowing what to look for turns a vague churn number into a prioritized fix list.
1. Lack of perceived value or ROI. The customer says something like “I’m not getting enough out of this.” Underneath, they’ve mentally repriced your product against what they’re actually using. Watch for declining session frequency paired with stable payment (they haven’t quit, they’ve just stopped caring). A B2B SaaS account that logs in once a month but pays for five seats is a walking cancellation.
2. Low usage or “I no longer need this.” This is the single biggest driver in app-focused data, with insufficient usage cited by a notable portion of canceling users, and some cross-industry surveys put “no longer needed” as a leading reason. Query your N-day active ratio and feature-adoption funnel. If a customer never completed onboarding’s core action, they were never activated in the first place.
3. Bugs, poor UX, and rough onboarding. Poor onboarding is one of the most frequently cited root causes of early churn because customers never reach the moment where the product proves its worth. Signals show up as high drop-off between signup and first meaningful action, plus a spike in support tickets tagged “how do I” within the first week.
4. Billing and payment failures, checkout friction. This is where involuntary churn lives, and it is often the most fixable category on this whole list. Card expirations, bank declines, and 3D Secure failures silently kill subscriptions the customer never meant to end. Billing-error rates vary sharply by platform: some datasets show failed charges as high as 28% on Google Play versus roughly 15% on the App Store. Check your failed-charge rate by payment processor and by card type before assuming this is a small problem.
5. Pricing changes and price sensitivity. A price increase notification is one of the cleanest churn triggers you can track because it has a specific date attached. Cohort the customers who received the notice and watch their cancellation rate in the following 30 to 60 days against a control group that didn’t see an increase.
6. Lack of subscription flexibility. No pause, no downgrade, no seasonal option. Customers who want to keep the relationship but reduce spend often cancel outright simply because pausing wasn’t offered as an alternative. If your cancel flow has no “pause for 30 days” button, you’re forcing an all-or-nothing decision on people who wanted a middle option.
7. Poor customer support or a frustrating self-service portal. Support-ticket sentiment tagged negative in the 30 days before cancellation is a strong predictive signal. So is a customer who tried to find billing settings and gave up, evident in session recordings or in a spike of “where do I cancel” searches on your own help center.
8. Competition and cheaper alternatives. These customers often researched before they canceled. Look for referral traffic from comparison sites or review platforms hitting your cancel page, and pay attention to exit-survey mentions of a named competitor.
9. Life changes and external economic pressure. Job loss, a household budget review, a seasonal need that ended. These cluster during recessions and after mass layoffs in a given industry, and they are largely outside your control. What you can control is whether the customer comes back later, which is why win-back sequences matter more here than anywhere else.
10. Subscription length and commitment friction. Annual plans that felt like a good deal at signup can feel like a trap eleven months later, especially if the customer wants out earlier and hits an early-termination fee or an inflexible term. Some cancel specifically because they never wanted a year-long commitment and forgot they signed one.
None of these categories exist in isolation. A customer citing “too expensive” during a period of low usage is really a value problem wearing a price complaint’s clothes, which is exactly why stated cancellation reasons match the actual underlying driver less than 27% of the time in some analyses. Treat the stated reason as a starting hypothesis, not a verdict.
Do Cancellation Reasons Differ by Product Type and Plan?
Streaming, apps, subscription boxes, and B2B SaaS each produce a different mix of reasons, and pretending they behave the same way wastes your retention budget on the wrong fix.
- Streaming services: price dominates. Statista’s survey data shows price as the largest single cancellation driver for video streaming subscribers, often tied to “finished the show I wanted” content-completion churn.
- Mobile and SaaS apps: low usage and billing errors lead, with cost close behind. Platform-level billing quirks (Google Play versus App Store) matter more here than in almost any other category.
- Subscription boxes: variety fatigue and product surplus. Customers accumulate unused items and cancel from clutter guilt, not dissatisfaction with quality.
- B2B SaaS: seat underutilization and champion turnover. When the person who bought the tool leaves the company, the subscription often follows within a quarter.
Monthly plans churn faster but recover faster too, since a paused monthly customer can restart with one click. Annual and freemium-to-paid conversions concentrate churn risk at renewal and trial-end, which means your intervention timing needs to shift with the billing model, not just the reason.
Pro Tip: Separate your churn analysis by tenure before drawing conclusions. Early churn (first 30 to 60 days) is almost always an onboarding and expectation problem; late churn is a price-fatigue and life-change problem. Applying an onboarding fix to a two-year customer, or a discount to a week-one cancel, wastes effort on the wrong lever.
How Do You Collect Cancellation Reasons Without Bias?
Ask the wrong way, and you’ll get an exit survey full of “too expensive” that actually means “I never opened the app after week one.” Structure matters as much as the questions themselves.
Build the flow in this order:
- Single-choice diagnosis first. Present 6 to 8 mutually exclusive reasons, including options people rarely think to add like “I forgot I was subscribed” and “my payment failed and I gave up trying to fix it.”
- Optional text box second, never required. Forcing free text before letting someone leave adds friction and depresses completion rates without improving data quality.
- One conditional follow-up. If they picked “too expensive,” ask what price would have felt fair. If they picked “not using it,” ask what they expected to get from it.
A tight exit-survey template looks like this: “Why are you canceling?” (single choice), “What would have kept you subscribed?” (optional text), “Would you consider coming back if we fixed this?” (yes/no/maybe), and a final optional field for anything else.
Do avoid leading language like “We’re sorry to see you go, was it the price?” That phrasing anchors the answer before the customer even thinks it through. Don’t force a text explanation, don’t collapse “payment failed” and “too expensive” into one option since they call for completely different fixes, and don’t skip the pause offer just because you’re gathering data.
Tag every stated reason in your CRM or product analytics platform, then join it against the customer’s actual behavior cohort. If someone says “too expensive” but their usage logs show daily engagement, that’s a genuine pricing problem. If they say “too expensive” but haven’t logged in for six weeks, you have a usage problem wearing a price complaint. Triangulating survey answers against support transcripts and payment event logs is the only way to catch this gap consistently.
Which Retention Tactics Fix Which Cancellation Reason?
Blanket discounts are the laziest response to churn, and they’re also one of the least effective. Matching the save offer to the actual reason produces meaningfully higher save rates than offering everyone the same 20% off coupon.
| Cancel Reason | Cancel-Flow Action | Metric to Track |
|---|---|---|
| Lack of perceived value | Feature demo or guided walkthrough of underused capability | Feature-adoption rate post-intervention |
| Low usage / not needed | Pause option (30 days) instead of cancel | Pause-to-reactivate rate |
| Bugs / poor onboarding | Route to guided setup or human onboarding call | Time-to-first-value |
| Billing / payment failure | One-click card update link, short grace period | Payment recovery rate |
| Price increase / sensitivity | Downgrade to lighter plan instead of full cancel | Downgrade retention rate |
| No flexibility | Offer skip-a-cycle or seasonal pause | Skip-rate vs. cancel-rate |
| Poor support experience | Priority callback before cancel completes | Support CSAT post-save |
| Found a cheaper alternative | Targeted discount tied to specific competitor gap | Win-back conversion rate |
Prioritize which of these to build first using a simple impact-versus-effort read. Payment recovery and pause options are almost always the highest-impact, lowest-effort plays because they require no new product work, just cancel-flow logic and a retry sequence. Feature demos and onboarding overhauls take longer to build but pay off over a longer horizon. Pick three plays this quarter: one from the low-effort/high-impact quadrant, one from the medium-effort/high-impact quadrant, and one experimental play you’re willing to kill if it underperforms in 60 days.
A sample dunning sequence for failed payments looks like this: on day 0, retry the charge automatically and send an email. On day 3, send a second retry attempt with an SMS nudge if you have a number on file. On day 7, show an in-app banner with a one-click card-update link. On day 10, apply a short grace period rather than immediate suspension. On day 14, if nothing has resolved, downgrade to a limited free tier instead of a hard cancel. Well-tuned retry logic and timely card-update prompts materially reduce this kind of involuntary churn, since payment failures represent one of the easiest places to recover MRR quickly.
Your quick-win checklist for this quarter:
- Add a pause button to the cancel flow. This alone can rescue a meaningful share of low-usage cancellations.
- Build a two-attempt retry sequence with a card-update link before any cancellation processes.
- Add a downgrade option for price-sensitive cancels instead of forcing a binary choice.
- Route “poor support” cancels to a priority callback queue for 48 hours before the cancellation finalizes.
Pro Tip: Diagnosing the reason before processing the cancellation, rather than after, is what makes these tactics work. A save offer shown after the account is already canceled converts at a fraction of the rate of one shown during the flow itself.
What Metrics Prove Your Retention Fixes Are Working?
Track five numbers, not fifteen. Customer churn rate (percentage of accounts canceling in a period) and MRR churn (revenue lost, which weighs high-value accounts more heavily) tell different stories, and a business can have flat customer churn while MRR churn climbs if larger accounts are the ones leaving. Add dunning recovery rate (what share of failed payments get fixed before cancellation), pause-to-reactivate rate (how many paused accounts come back), and LTV lift for cohorts that received a specific intervention.
Structure cohort analysis by acquisition channel, plan tier, and onboarding completion status, since a paid-ad cohort often churns faster than an organic cohort regardless of what you fix. Use a 30 to 60 day window for early-churn cohorts and a 6 to 12 month window for late-churn cohorts, because averaging the two together hides both problems.
For any cancel-flow experiment, outline it before you launch: state the hypothesis (“offering a pause reduces low-usage cancellations by X”), pick one metric, define your population (new cancels only, or all cancels), set a guardrail (don’t let average revenue per user drop), and estimate a sample size large enough to detect a real difference rather than noise.
Can App Pricing Data Reveal Hidden Price-Driven Churn?
Internal churn cohorts tell you that customers left after a price change. They rarely tell you whether your new price is actually out of line with the market, or whether the timing just happened to collide with a competitor’s promotion. That’s a market-context gap, not a customer-feedback gap.
The practical workflow: pull your churn cohort exposed to a recent price increase, then check that price band against category benchmarks and localized pricing patterns across markets. Apppricer aggregates real app prices, subscription structures, and revenue trends across 175 countries, which turns “did we price too high?” from a guess into a comparison against what similar apps in your category actually charge in each market.
- Run a targeted price experiment on a small cohort before rolling a change out globally.
- Compare your trial-to-paid conversion against category norms before assuming a low conversion rate is a product problem rather than a price one.
- Watch for a market-wide price shock (competitors raising prices in the same window) that could explain a churn spike unrelated to your own pricing decision.
Pro Tip: If your churn spike lines up with a price increase, check whether competitors moved their prices in the same quarter. A market-wide shift changes what “too expensive” actually means to your customers.
When Resources Are Tight, Where Should You Focus First?
Fix involuntary churn before anything else. Payment failures are mechanical, not emotional, which makes them the fastest wins available: a retry sequence and a card-update prompt can be shipped in weeks, not quarters, and the revenue recovered funds the harder work that follows.
After that, prioritize low-friction cancel-flow saves, pause options and downgrades, since they require no deep product changes. Only once those two categories are handled should you move into onboarding redesigns and product-value work, which take longer and carry more organizational risk.
Get payments, product, customer experience, and BI in the same room monthly to review what the cancel-flow data actually shows, not what each team assumes it shows. Write down what worked and what didn’t in a shared playbook, because the same reason resurfaces every renewal cycle and nobody should have to relearn the fix from scratch.

There’s a real trade-off between acquiescing to a customer’s stated price objection and investing in the product fix that would have prevented the cancellation altogether. Discounts buy time; they don’t buy loyalty.
How Apppricer Helps You Test Pricing-Driven Churn Theories
If your churn spike lines up with a price change, the next question isn’t “should we roll it back,” it’s “was our price actually out of line with the market.” That’s a question internal data alone can’t answer, because you’re comparing your own price against your own history, not against what competitors are actually charging in the same category.
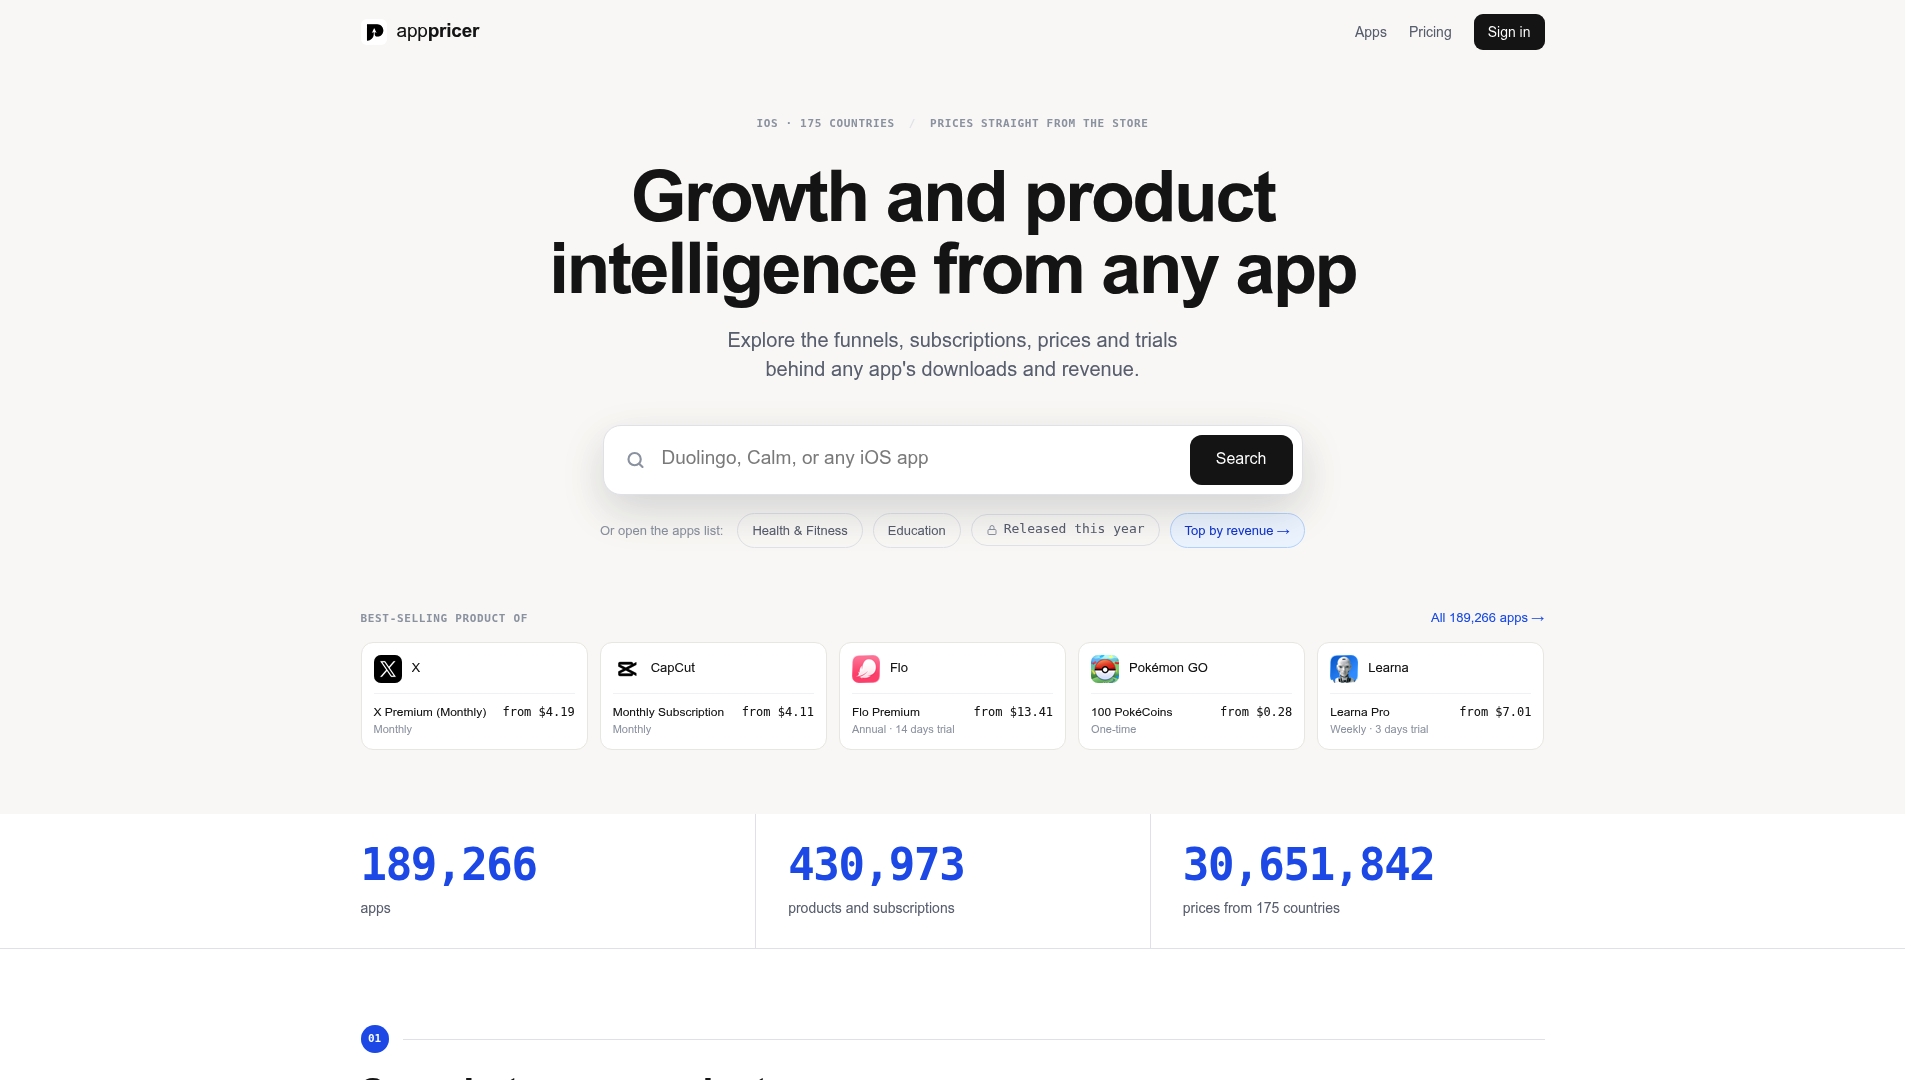
Apppricer pulls real subscription prices, revenue estimates, and download trends for iOS apps across 175 countries, so you can see whether a competitor quietly raised or dropped prices in the same window your cancellations spiked. That context turns a churn postmortem into a testable hypothesis: was this a product problem, a timing problem, or simply a market-wide price adjustment nobody flagged internally. Browse category pricing examples to benchmark your own plan against similar apps in your niche, or head to the Apppricer product page to start pulling competitor pricing data for your next retention review.
Frequently Asked Questions
What is the single biggest subscription cancellation reason? Cost and perceived value top most cross-industry surveys, cited by around 63% of canceling subscribers, though low usage runs a close second in app-specific data.
How much of subscription churn is involuntary? Failed payments and expired cards typically account for 20 to 40% of total churn, making dunning sequences and card-update prompts some of the highest-return fixes available.
Should every cancellation reason get a discount offer? No. Blanket discounts underperform offers matched to the actual reason, since a pause fits low usage, a downgrade fits price sensitivity, and a card-update link fits payment failures far better than a generic coupon.
How do I know if a stated cancellation reason is accurate? Cross-check it against behavior data.
Does subscription length affect cancellation rates? Yes. Annual commitments concentrate cancellation risk at renewal and can trigger cancellations from customers who forgot the length of their term, while monthly plans churn more often but recover faster through easy restarts.
Sources
- Top reasons for streaming cancellations U.S. 2023 - Statista
- Churn in subscription apps: top 5 cancelation reasons (and what to do about them) | RevenueCat
- Subscription Cancellation Statistics (2025–2026)
- Top 9 Subscription Cancellation Reasons + How to Fix Each | Recurx