Use Apppricer to Model RPD Against $1.40 Benchmarks for Developers

Revenue per download (RPD) is total app revenue divided by total downloads over a given period, and it works best as a diagnostic, not a scoreboard. A low number tells you where to dig, whether that’s weak retention, a mismatched monetization model, or a user acquisition channel pulling in the wrong crowd. This article breaks down the formula, the benchmarks by category and platform, and the specific levers that move RPD in either direction.
TL;DR:
- Variations in monetization models significantly impact RPD, with subscription-based apps often achieving higher per-download revenue than ad-supported ones.
- Accurate RPD calculation requires excluding fraudulent and refunded installs from the denominator and aligning revenue and download windows properly.
- Industry benchmarks indicate a global average RPD around $1.40, but category-specific ranges vary from under $0.20 to over $5.00 per download.
- Platform and regional differences cause substantial shifts, with iOS and Western markets typically generating higher revenue per download than Android and emerging markets.
- Optimizing RPD involves targeted retention, pricing experiments, ad revenue strategies, and geo-specific user acquisition, guided by market data and scenario modeling.
Table of Contents
- Revenue Per Download Formula and What Counts as Revenue
- Common Measurement Mistakes That Skew RPD
- What Counts as a Good Revenue Per Download
- What Actually Drives Your Revenue Per Download
- How to Calculate Revenue Per Download Step by Step
- Practical Ways to Raise Revenue Per Download
- Modeling RPD With Market Data and Apppricer
- Why RPD Should Guide Questions, Not Decisions
- Try Apppricer to Model Your Own Revenue Per Download
- Where These Benchmarks Come From
- Sources
- FAQ
Revenue Per Download Formula and What Counts as Revenue
The basic formula is simple: RPD = total revenue ÷ total downloads over a set period. The complication is what you put in the numerator.
Most teams calculate RPD two ways, and mixing them up leads to bad comparisons. Gross RPD counts every dollar the app generates before app stores take their cut. Net RPD (sometimes called proceeds-based RPD) subtracts the platform commission, refunds, and any applicable taxes first. Adapty’s revenue guide walks through this distinction in detail, and it matters because a 30% commission on In-App Purchases changes your real per-download economics substantially.
Revenue sources that should go into the numerator:
- In-app purchases (consumables, one-time unlocks, virtual goods)
- Subscription revenue, including renewals within the measurement window
- Ad revenue from all formats (rewarded video, interstitial, banner, native)
- Paid app purchase price, if the app charges upfront
Use gross RPD when benchmarking against public data like Statista’s figures, since most published averages are gross. Use net RPD internally when modeling actual cash you can reinvest into acquisition.
Common Measurement Mistakes That Skew RPD
The denominator causes more confusion than the revenue side. Raw install counts from your app store console include downloads that got refunded, failed to complete, or came from fraudulent click farms. Billable downloads, the number that survived cancellation windows and refund periods, give a cleaner picture.
Timing is the second trap. Revenue often front-loads: a burst of launch-week purchases can make RPD look strong for 30 days, then fade once trial conversions and organic curiosity wear off. Comparing a 7-day RPD from one cohort to a 90-day RPD from another produces numbers that look comparable but aren’t measuring the same thing at all.
- Match your revenue window to your download window (don’t count 90 days of revenue against 30 days of installs)
- Exclude fraudulent or refunded installs from the denominator when the data is available
- Track when store commissions post to your accounting, since delayed commission recognition can make a month look more profitable than it was
Pro Tip: Run RPD on a rolling 30-day cohort basis rather than calendar months. Calendar months mix new-user spikes with older cohorts and make trend lines noisy for no good reason.
What Counts as a Good Revenue Per Download
The global average revenue per download is projected around $1.40 in 2026. The market is expected to see hundreds of billions of downloads worldwide. That figure blends free apps monetized through ads, paid apps, and everything with in-app purchases, so treat it as a starting reference point rather than a target.
By the numbers: Global average RPD sits near $1.40, but category-level ranges swing from under $0.20 to over $5.00 depending on monetization model and audience.
Category ranges tell a more useful story than the global average. Industry roundups put typical figures in the $0.50 to $2.00 range for most apps, with meaningful spread by type:
- Games: roughly $0.10 to $1.50 per download, heavily dependent on ad density and whale-driven IAP spending
- Fitness and subscription-led apps: often $2.00 to $5.00 per download, since a small percentage of paying subscribers can carry the whole cohort
- Utilities: around $0.80 to $2.50, typically lower variance than games or subscriptions
Technology category matters too. Statista’s dataset on AI applications shows apps like Perplexity and Claude posting gross revenue per download well above general-category norms between May 2025 and May 2026, reflecting both premium pricing and a willingness among early AI adopters to pay.
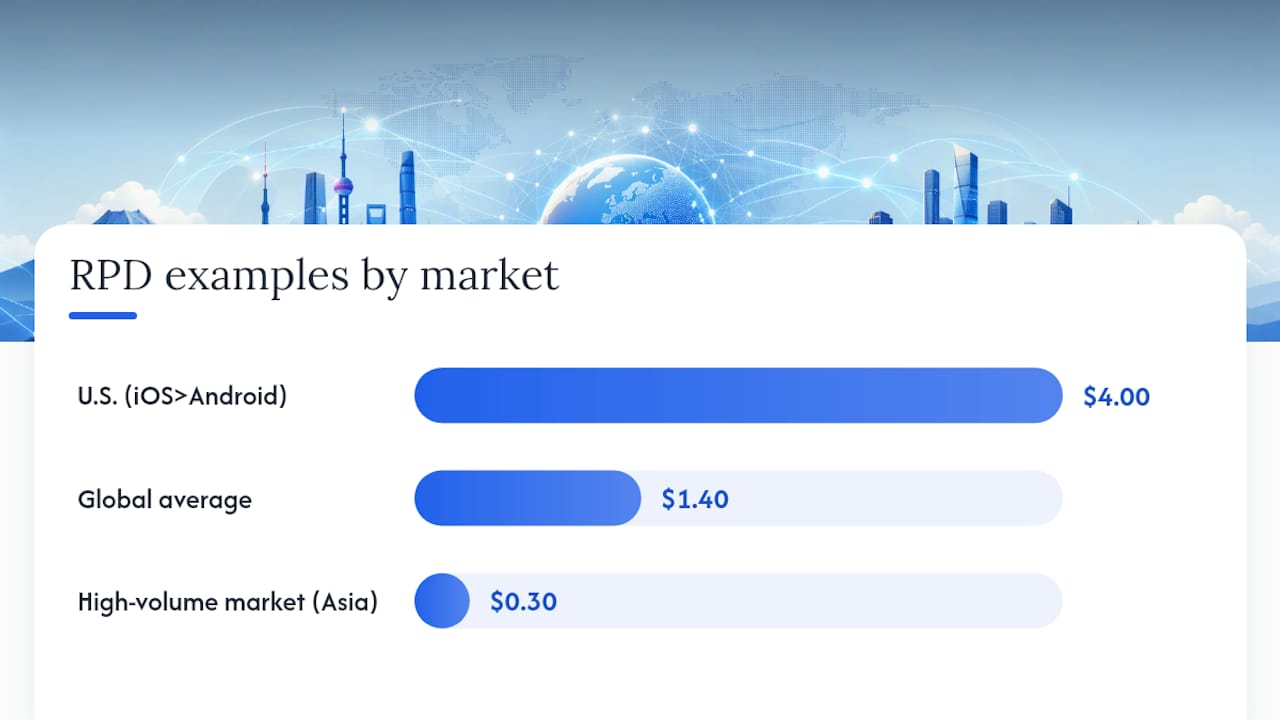
Platform and region shift these numbers further. iOS users historically spend more per download than Android users across nearly every category, partly due to demographic skew toward higher-income markets. Within any platform, U.S. and Western European users tend to generate several times the per-download revenue of users in South or Southeast Asia, where price sensitivity is higher and ad rates run lower. A $1.40 global average can hide a $4.00 U.S. figure sitting next to a $0.30 figure in a high-volume, low-ARPU market.
What Actually Drives Your Revenue Per Download
RPD isn’t one number with one cause. It’s the output of several variables stacked on top of each other, and figuring out which one is dragging your number down is the entire point of tracking it.
Monetization model sets the ceiling. A pure ad-supported app caps out at whatever eCPMs your ad network and geo mix support, usually cents per user per month. A subscription app with a strong trial-to-paid conversion rate can produce RPD many multiples higher, because a single annual subscriber contributes as much as dozens of ad impressions ever could. Paid-upfront apps front-load all their revenue into the download event itself, which makes RPD look deceptively clean but caps growth potential once the install base saturates.
Retention decides how much of that ceiling you actually reach. An app that loses 80% of users by day 7 never gets the chance to convert them into subscribers or repeat IAP buyers, no matter how good the monetization model is on paper.
- Acquisition channel quality varies wildly: influencer-driven installs often convert differently than paid search or App Store Search Ads traffic
- Device type correlates with spending power, and iOS-heavy campaigns tend to post higher RPD than Android-heavy ones
- Product-market fit shows up directly in price sensitivity; a well-targeted niche app can charge more without hurting conversion
Geography ties all of this together, since acquisition cost, retention behavior, and willingness to pay all shift by country simultaneously, not independently.
How to Calculate Revenue Per Download Step by Step
Getting a usable RPD number takes a few deliberate choices before you touch a calculator.
- Pick your cohort window. Day-0 RPD tells you what launch-week buyers spent immediately; 30-day or rolling 30-day cohorts capture early subscription conversions and repeat purchases without waiting for the full customer lifecycle to play out.
- Decide gross or net. Subtract App Store or Google Play commission (typically 15% to 30%), refunds, and VAT where applicable to get net proceeds, the number that actually hits your bank account.
- Divide revenue by billable downloads for that same window, not raw install counts pulled straight from your dashboard.
- Run the math at scale to sanity-check assumptions. At 1,000 downloads with $1,400 in 30-day revenue, RPD is $1.40, matching the global average. At 100,000 downloads generating $180,000, RPD drops to $1.80, which might reflect a stronger subscription mix. At 1,000,000 downloads producing $350,000, RPD falls to $0.35, typical of an ad-heavy game with a long tail of low-value installs.
- Compare RPD against blended CAC. If your cost to acquire a user exceeds expected RPD times expected retention multiplier, that channel is burning cash regardless of what your top-line download count looks like.
The sensitivity in step 4 matters more than the point estimate. A Shutterstock contributor earnings table shows how dramatically per-transaction revenue shifts based on buyer plan and pricing tier, the same principle that applies when your app’s mix shifts between free-tier users and premium subscribers.
Practical Ways to Raise Revenue Per Download
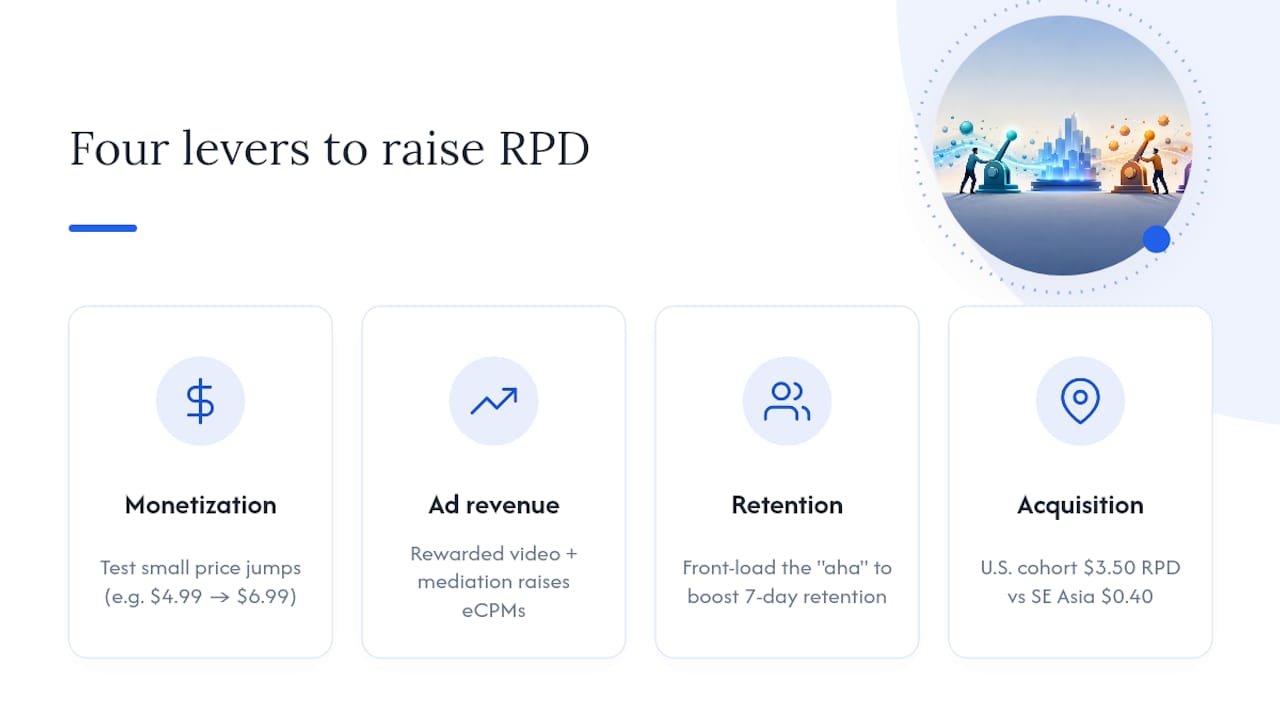
Improving RPD comes down to four levers, and the biggest mistake developers make is pulling all four at once without measuring which ones actually worked.
Monetization experiments move the needle fastest when they’re structured properly. Test price points in small increments (a $4.99 to $6.99 jump on a subscription tier) rather than doubling prices outright, since large jumps distort conversion data and make it hard to isolate what caused the change. Tiered IAP structures, offering a cheap entry-level purchase alongside a premium bundle, often lift average transaction value without hurting conversion at the low end. Subscription trial flows matter enormously here; a 7-day free trial with a clear paywall reminder typically converts better than a 3-day trial that ends before users see real value.
Ad revenue optimization is often the fastest low-effort win for free-to-play apps. Rewarded video placements (offering in-game currency for watching an ad) tend to produce far better user sentiment and eCPMs than forced interstitials. Running multiple ad networks through a mediation layer, rather than relying on one network, typically lifts effective eCPM because networks compete for the same impression in real time.
Retention is the lever growth practitioners point to most often when RPD stalls, since revenue can’t materialize from users who already left. Onboarding improvements, cutting friction in the first session, front-loading an “aha moment,” tend to have outsized effects on 7-day retention. Personalized push notifications and re-engagement campaigns targeted at lapsed but not-yet-churned users often recover revenue that a generic broadcast notification would miss entirely.
Acquisition levers work by concentrating spend where RPD is already strongest. If your U.S. cohort produces $3.50 RPD and your Southeast Asia cohort produces $0.40, shifting UA budget toward the higher-value geo, even at a higher cost-per-install, usually improves blended profitability. Segmenting campaigns by channel quality (App Store Search Ads versus social versus influencer) lets you kill underperforming channels before they drag your average down.
Pro Tip: Before running any pricing or monetization experiment, set a retention guardrail.
Modeling RPD With Market Data and Apppricer
Public benchmarks tell you the market average. They don’t tell you what a specific pricing strategy in a specific country would do to your revenue, which is where scenario modeling earns its keep.
- Start with your baseline assumptions. Pull a category benchmark (say, $1.80 for a mid-tier subscription utility) and your own historical conversion rate as a sanity check before changing anything.
- Check what competitors actually charge. Browsing iOS apps by price and subscription model across markets shows you real pricing and trial structures competitors use in each country, rather than guessing at a monthly price that “feels right.”
- Set conversion and ARPU assumptions per country, since a $9.99 monthly subscription that converts well in the U.S. might need a lower local price point in markets with weaker purchasing power to hit similar conversion rates.
- Run best-case and worst-case scenarios. A small shift in trial-to-paid conversion, even two or three percentage points, can swing projected RPD substantially, so model both directions before committing budget.
- Cross-check against the Statista global average to see whether your projected RPD sits above or below the $1.40 benchmark, and treat any large gap as a signal worth investigating.
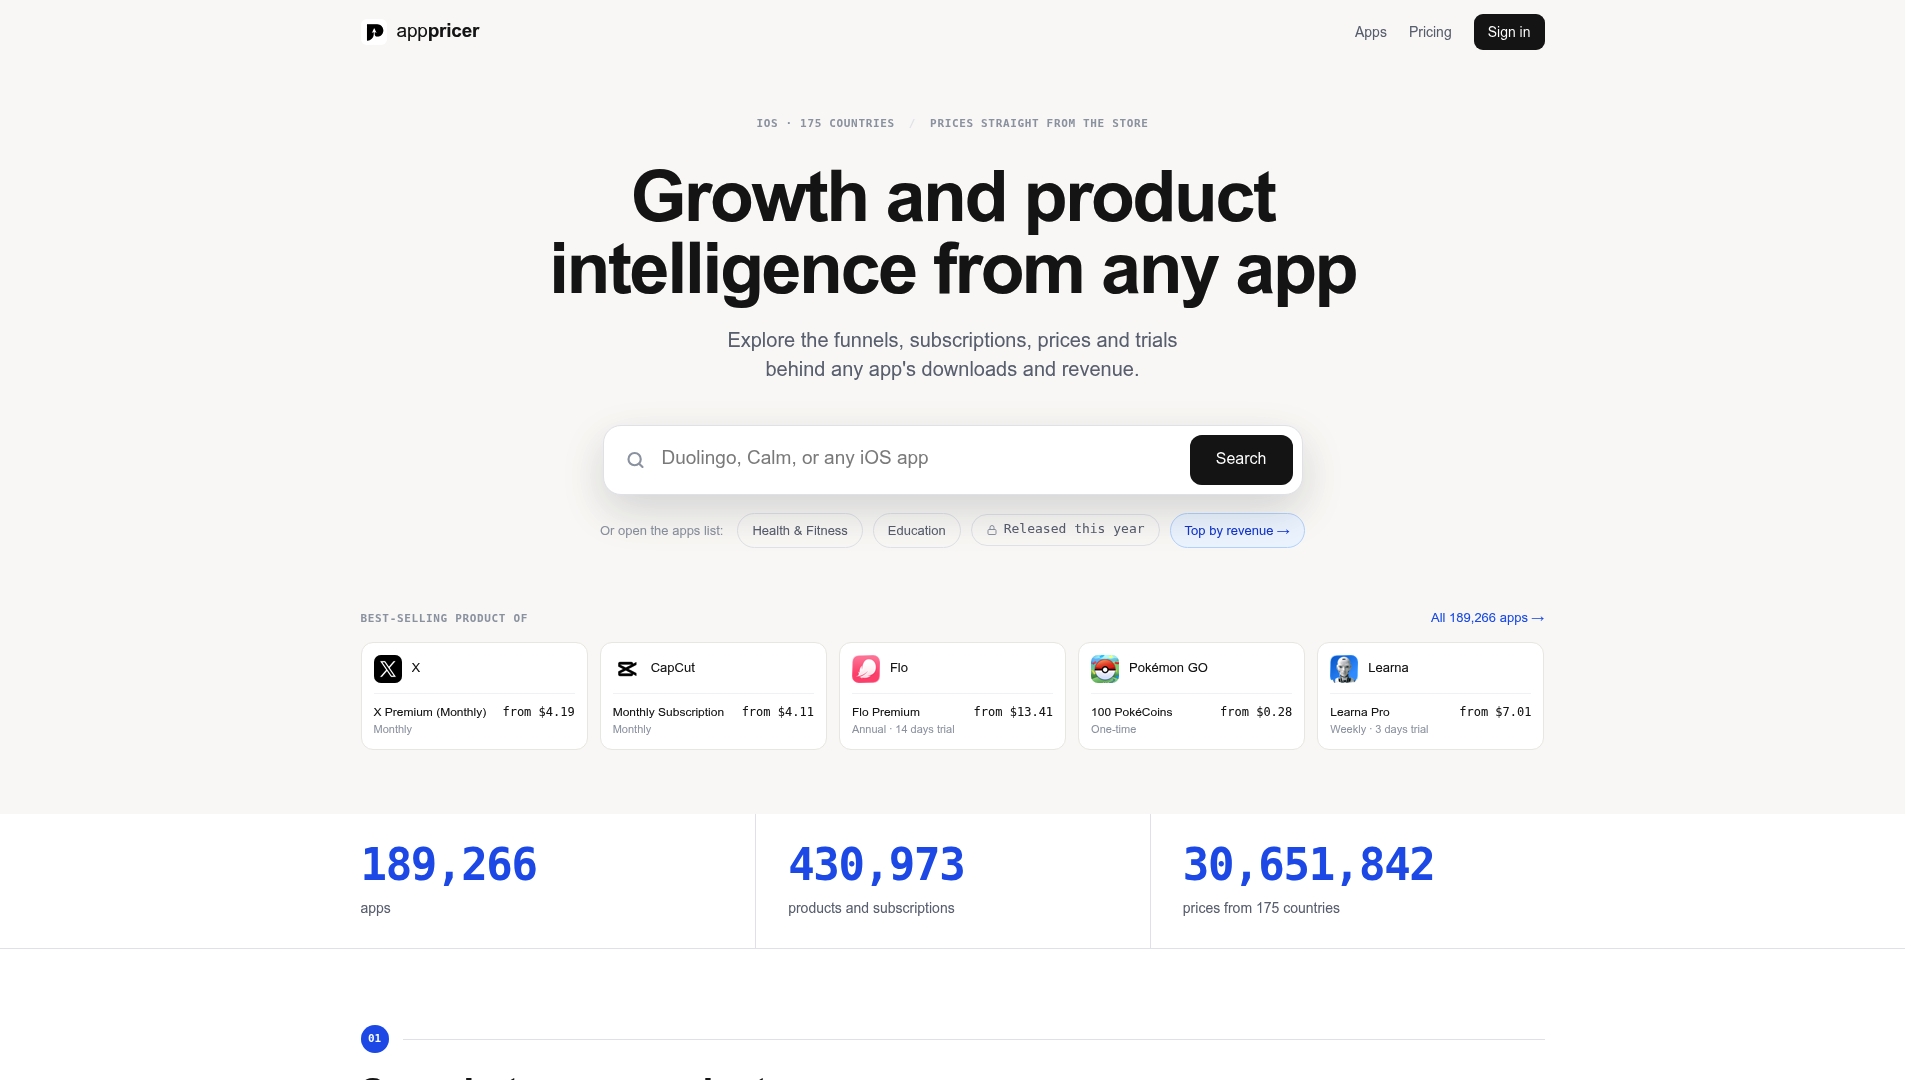
Apppricer’s aggregated pricing and subscription data across 175 countries turns steps 2 and 3 from guesswork into a lookup, which matters most when you’re deciding whether a market is worth localizing pricing for at all.
Why RPD Should Guide Questions, Not Decisions
RPD tells you something is off. It rarely tells you what, and that distinction gets lost when teams treat it as a single target to hit rather than a starting point for investigation.
A dropping RPD could mean retention collapsed, your monetization model stopped fitting your audience, or your acquisition channels started pulling in lower-intent users. The number looks identical in all three cases. The fix isn’t chasing RPD upward directly. It’s tracing the number back to whichever part of the funnel actually broke, then testing a fix there.
Sustainable growth usually comes from stacking small wins: fix retention first, since a user who churns on day 2 never gets a chance to spend money, then layer monetization experiments on top of a healthier base. Chasing RPD growth through aggressive monetization on a leaky retention funnel usually backfires within two or three months.
— Sergey
Try Apppricer to Model Your Own Revenue Per Download
Guessing at a competitor’s pricing strategy wastes weeks that a direct comparison could save in an afternoon. Aggregated app prices, subscription tiers, and trial structures across many countries allow you to look up what top-performing apps charge in different markets, helping build your RPD model on market data instead of assumptions.
The fastest way to see this in action: pick one country where you suspect your pricing is off, pull comparable iOS app pricing and subscription data for that market, and run your own RPD projection against the $1.40 global benchmark. If your number comes in well below competitors charging similar prices, that gap usually points to a monetization or retention problem worth fixing before you spend another dollar on acquisition. Check the full revenue tracking toolset to set up ongoing benchmarking instead of running one-off comparisons every quarter.
Where These Benchmarks Come From
The Statista app market outlook provides the global RPD figure and download forecasts cited above. Adapty’s revenue guide breaks down gross revenue versus net proceeds after store commissions. The Unanswered.io industry roundup supplies category-level ranges for quick benchmarking, and broader AI market revenue data offers useful context on how fast-growing app categories can outpace general averages.
Sources
- App - Worldwide | Statista Market Forecast
- How much does an app make: Adapty’s ultimate app revenue & VAT guide
- Unanswered
FAQ
How much can an app with 1,000 downloads make?
At the global average RPD of roughly $1.40, 1,000 downloads would generate around $1,400 in revenue, though subscription-heavy apps could produce several times that if trial conversion rates are strong.
How much can an app with 1 million downloads make?
Revenue scales with your actual RPD, not the global average alone. An ad-supported game at $0.35 RPD would generate roughly $350,000 from a million downloads, while a subscription app with a stronger mix might generate substantially more revenue over the same volume.
How much does a game with 100,000 downloads make?
Games typically post RPD between $0.10 and $1.50, so 100,000 downloads could generate revenue varying widely depending on ad density, IAP design, and whale-driven spending.
What apps legitimately pay users or generate steady daily revenue?
Legitimate revenue-generating apps typically rely on subscriptions, in-app purchases, or ad monetization rather than paying users directly; tools like Apppricer’s app tracker can help you benchmark which pricing and subscription models in your category actually sustain steady daily revenue.
Is a higher revenue per download always better?
Not necessarily. A high RPD built on a shrinking user base or unsustainable pricing can mask a retention problem, so it’s worth pairing RPD with cohort LTV and CAC before treating it as a success metric on its own.