App Product Teams: Regional Pricing With PPP and 2–3 Test Markets

Regional pricing means charging different prices for the same product across markets, based on what each market can actually pay. The recommended approach is a hybrid, data-driven model: keep your packaging and tiers consistent everywhere, but adjust the actual price points by region using purchasing power parity (PPP) benchmarks and local market calibration. The rest of this playbook shows you how to build, test, and govern that model without wrecking your margins or your brand.
TL;DR:
- Use a data-driven hybrid model combining consistent packaging and tier structures with regional price adjustments based on purchasing power parity benchmarks.
- Match your chosen model—zone pricing, PPP-based tiered, freight-absorption, or uniform pricing—to your product type and market spread, avoiding mismatched strategies.
- Conduct thorough market segmentation, set clear mapping rules, and test pricing in select regions before broad deployment, focusing on long-term value over short-term gains.
- Monitor platform-specific constraints, such as app store price tiers and regional regulations, while implementing fraud controls and maintaining price governance through regular reviews.
- Communicate price differences transparently to customers by clearly explaining the economic reasons, avoiding secrecy that breeds mistrust and arbitrage.
Table of Contents
- What Are the Main Regional Pricing Models?
- Why Does Regional Pricing Work?
- How Do You Implement Regional Pricing Step by Step?
- What Should App and SaaS Teams Watch For?
- How Do You Test Regional Pricing Changes?
- How Do You Govern Regional Pricing Without Losing Control?
- How Do You Communicate Price Differences to Customers?
- What Do Practitioners Get Wrong About Regional Pricing?
- Benchmark Before You Price
- Sources
What Are the Main Regional Pricing Models?
Every regional pricing strategy borrows from a handful of established models, each with a different tradeoff between simplicity and precision. Picking the wrong one for your product category is the most common mistake pricing teams make.
Zone pricing groups countries or regions into buckets (Tier 1, Tier 2, Tier 3) and assigns one price per bucket. It’s the workhorse model for SaaS and apps because it scales without requiring a unique price for all 175-plus countries you might operate in.
PPP-based tiered pricing uses purchasing power parity data to set price ratios between regions. A subscription priced at $10 in the United States might land at $4 in a lower-income market, not because the product is worth less, but because local income and cost-of-living data say that’s the equivalent value. This is the model Stripe describes as the dominant approach for digital subscriptions.
Freight-absorption and FOB (free on board) pricing matter more for physical goods. FOB pricing means the buyer pays shipping from the seller’s location; freight absorption means the seller eats some or all of that cost to stay competitive in distant markets. Retailers and manufacturers use these constantly, especially for anything heavy or bulky.
Basing-point pricing sets a fixed reference point (often a factory or hub) and calculates delivered prices as if shipped from there, regardless of the actual shipping origin. It’s fallen out of favor in some industries due to antitrust scrutiny, but it still appears in commodities and industrial goods.
Uniform delivered pricing charges the same price everywhere, with shipping costs averaged into the base price. It’s the simplest model and the easiest to communicate, but it means efficient-to-serve customers subsidize expensive-to-serve ones.
Here’s how to match model to business type:
- SaaS and apps: PPP-tiered or zone pricing, layered on a competitor index.
- E-commerce with physical shipping: freight absorption or zone pricing, depending on margin tolerance.
- Gas stations and commodities: zone pricing tied to local supply costs and competition.
- Enterprise B2B with high-touch sales: market-specific pricing negotiated per deal, informed by regional benchmarks rather than a rigid formula.
These aren’t mutually exclusive. Most mature companies blend two: a tiered PPP structure for self-serve customers and negotiated market pricing for enterprise accounts, all documented in Wikipedia’s overview of geographical pricing methods.
Why Does Regional Pricing Work?
The core case for regional pricing is simple: a single global price either overcharges price-sensitive markets out of the market entirely, or undercharges wealthy markets that would happily pay more. Both outcomes leave money on the table.
The revenue upside shows up in two places. You capture willingness to pay in high-income markets by pricing closer to what they’ll actually spend, and you unlock volume in price-sensitive markets that a flat global price would exclude. Stripe’s research found that 83% of customers compare prices while shopping, which means your price sits in a competitive context whether you plan for that or not.
The trade-offs are real, though, and worth naming plainly:
- Perception risk. Customers in high-price regions who discover a lower price elsewhere can feel cheated, even when the difference is fully justified by local economics.
- Arbitrage. VPNs, gift cards, and account sharing let determined users buy at the lowest regional price regardless of where they live.
- Tax and accounting load. Different regions carry different VAT, sales tax, and revenue-recognition rules, and your finance team inherits that complexity the moment you launch region-specific pricing.
- Not always worth it. If your customer base is concentrated in one or two markets, or your margins are already thin, the operational overhead of regional pricing can outweigh the incremental revenue.
Regional pricing earns its complexity when you have real geographic spread in your user base and enough margin to absorb testing costs. Below that threshold, it’s often a distraction from higher-leverage work.
How Do You Implement Regional Pricing Step by Step?
A regional pricing analysis fails most often not because the math is wrong, but because teams skip a step and find out six months later. Work through these in order.
- Define objectives and guardrails first. Decide whether the goal is market expansion, revenue maximization, or competitive defense, and set a margin floor you will not price below regardless of what a region’s PPP data suggests.
- Collect your inputs. Pull PPP and GDP-per-capita figures from the OECD’s purchasing power parity indicators or the World Bank’s International Comparison Program, then layer in local competitor pricing and your actual cost-to-serve for each market, including shipping, taxes, and regional marketing spend. Acquisition costs alone can shift materially by region, which is worth factoring in the way SaaS growth teams model channel costs when planning regional budgets.
- Segment markets into tiers or zones. Three to five tiers is usually enough. More granularity adds maintenance burden without meaningfully improving accuracy.
- Set your mapping rules. Decide the formula that converts a PPP ratio or competitor benchmark into an actual price point, and document it so the next person on your team doesn’t have to reverse-engineer your logic.
- Work out price mechanics. This includes local rounding conventions (some markets expect prices ending in .99, others don’t), currency display, tax-inclusive versus tax-exclusive pricing, and how the price renders in your checkout UI.
- Build the technical infrastructure. You need geolocation detection, region-specific price lists, support for local payment methods, and fraud controls to catch users spoofing their location to reach a cheaper tier.
- Choose test markets and run controlled experiments. Start with two or three markets that represent different tiers, not your entire footprint.
- Measure lifetime value, not just conversion. A price cut that boosts sign-ups but tanks retention isn’t a win. RevenueCat’s guidance on price localization stresses validating changes against LTV and retention rather than conversion alone.
Pro Tip: Build a competitor index of just 10 comparable apps or products per target market before you touch your own pricing. It’s a fast way to sanity-check whether your planned price sits in a defensible range, and it takes a fraction of the time a full market study would.
Don’t treat this as a one-time project. Markets shift, currencies move, and competitors reprice. The checklist above is something you rerun, not something you file away.
What Should App and SaaS Teams Watch For?
Apps and subscription software face constraints that physical-goods sellers don’t, and ignoring them is how regional pricing projects stall inside legal or platform review.
- App-store price tiers are fixed bands, not free-form numbers. Both iOS and Google Play require you to select from predefined price points per currency, which limits how finely you can tune a region’s price and complicates clean A/B tests across price bands.
- PPP-based tiering works well for broad subscription pricing but breaks down for niche categories. A specialized B2B tool with three competitors in a given country needs market-specific pricing informed by those actual competitors, not a generic PPP ratio.
- Packaging adjustments often outperform raw price cuts. Instead of just lowering the price of an annual plan, some teams add a weekly or monthly option in price-sensitive regions, which improves accessibility without discounting the product’s perceived value.
- Existing subscribers complicate everything. Platform rules, notably Apple’s requirement for explicit customer opt-in on certain price increases, directly affect how you sequence a rollout and how much churn you should expect to plan for.
Checking aggregated app pricing and subscription data across markets before you set your own tiers gives you a real benchmark instead of a guess, which matters more in this category than almost any other, because app-store price bands leave you little room to correct a mistake quickly.
How Do You Test Regional Pricing Changes?
Pricing experiments live or die on sample size and patience. Rushing either one produces a result that looks clean and is actually noise.
- Design an A/B or cohort test per market, not a single global test. Regional behavior varies too much to average together.
- Run tests long enough to observe a full billing cycle, ideally two, so you capture renewal behavior, not just initial sign-up.
- Track conversion, average revenue per user (ARPU), lifetime value, churn, refund rates, and support ticket volume together. A price change that lifts conversion but spikes refunds and support load is not a win, even if the headline metric looks good.
- Weight long-term value over short-term conversion. A lower price that brings in users who churn within a month is worse than a higher price that brings in fewer, stickier customers.
RevenueCat’s research on price localization for apps recommends testing with bold price swings early rather than incremental nudges, because small changes take longer to produce a statistically readable signal and larger swings reveal elasticity faster. That single choice, testing big instead of testing timid, is probably the fastest way to shorten a pricing experiment cycle that would otherwise drag on for a full quarter.
How Do You Govern Regional Pricing Without Losing Control?
Regional pricing multiplies your number of active price points, and each one needs an owner, or the system decays within a year.
- Tax and accounting need a seat at the table early. Local prices shown to customers and net revenue recognized internally are not the same number once VAT, sales tax, and currency conversion enter the picture, and finance needs to model that before launch, not after.
- Anti-abuse controls matter from day one. Billing-country verification, payment-method restrictions tied to region, and ongoing fraud monitoring stop the arbitrage that would otherwise erode your tiered pricing within months.
- Set a review cadence. Quarterly is reasonable for most SaaS products; annual is too slow given how fast currencies and local competition move.
- Version your price lists like you version code. Someone should be able to answer “what was our price in this market six months ago” without digging through spreadsheets. Combining cost-based inputs with live market signals, rather than relying on either alone, is the approach Investopedia’s overview of geographical pricing recommends to avoid systematic mispricing.
How Do You Communicate Price Differences to Customers?
Customers generally accept regional price differences when the reasoning is visible and matches their own sense of local economics. What they don’t accept is silence, followed by discovering a lower price by accident.
- State the reasons plainly when asked: local taxes, currency, and cost of living, not vague language about “market conditions.”
- Give support teams a short, consistent script for price questions, so five different agents don’t give five different explanations.
- Grandfather existing customers when you raise prices in their region, at least for a defined transition window, rather than forcing an immediate jump.
Pro Tip: Publish your regional pricing logic internally before a customer ever asks about it. The teams that get burned publicly are almost always the ones improvising an explanation in real time.
Stripe’s data backs this up directly: transparency about the “why” behind a regional price difference is what keeps customers from feeling like they got a worse deal than someone else.
What Do Practitioners Get Wrong About Regional Pricing?
The biggest mistake I see is teams treating regional pricing as a one-time pricing project instead of an ongoing operational discipline. You set the tiers, launch, and move on.
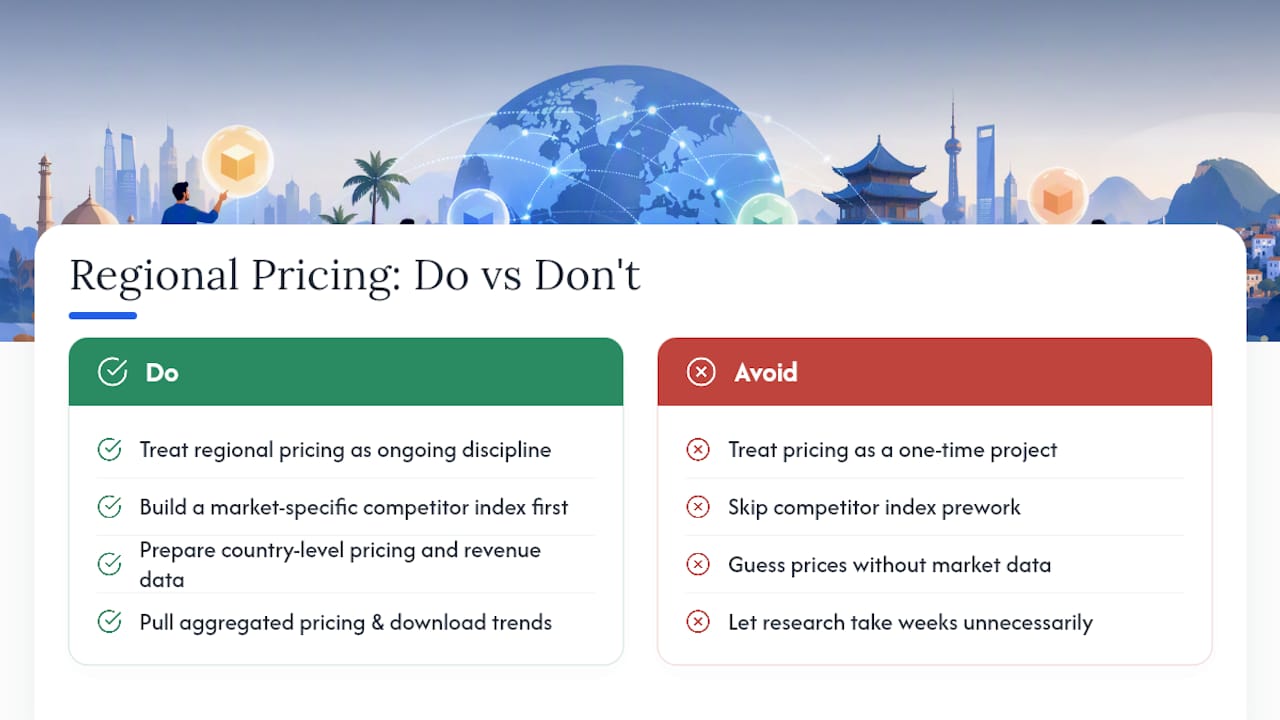
The second mistake is skipping the competitor index because it feels like extra work before the “real” pricing decision. It’s the opposite. A market-specific competitor index built before you touch your own numbers is what keeps a PPP ratio from producing a price that’s mathematically defensible but commercially absurd for that market.
What actually shortens the research cycle is having country-level pricing and revenue data on hand before you start guessing. Pulling aggregated pricing and download trends across markets turns a multi-week competitive research phase into an afternoon of comparison, and that speed matters more than most teams give it credit for, because the market you’re pricing against won’t wait for your spreadsheet.
— Sergey
Benchmark Before You Price
Every step in this playbook depends on knowing what competitors actually charge in each market, and guessing that number is where most regional pricing projects go wrong. There are tools that track country-by-country app prices, subscription bands, and download and revenue trends across multiple countries, which can turn the competitor index in Step 2 of the implementation checklist from a manual scramble into a data pull.
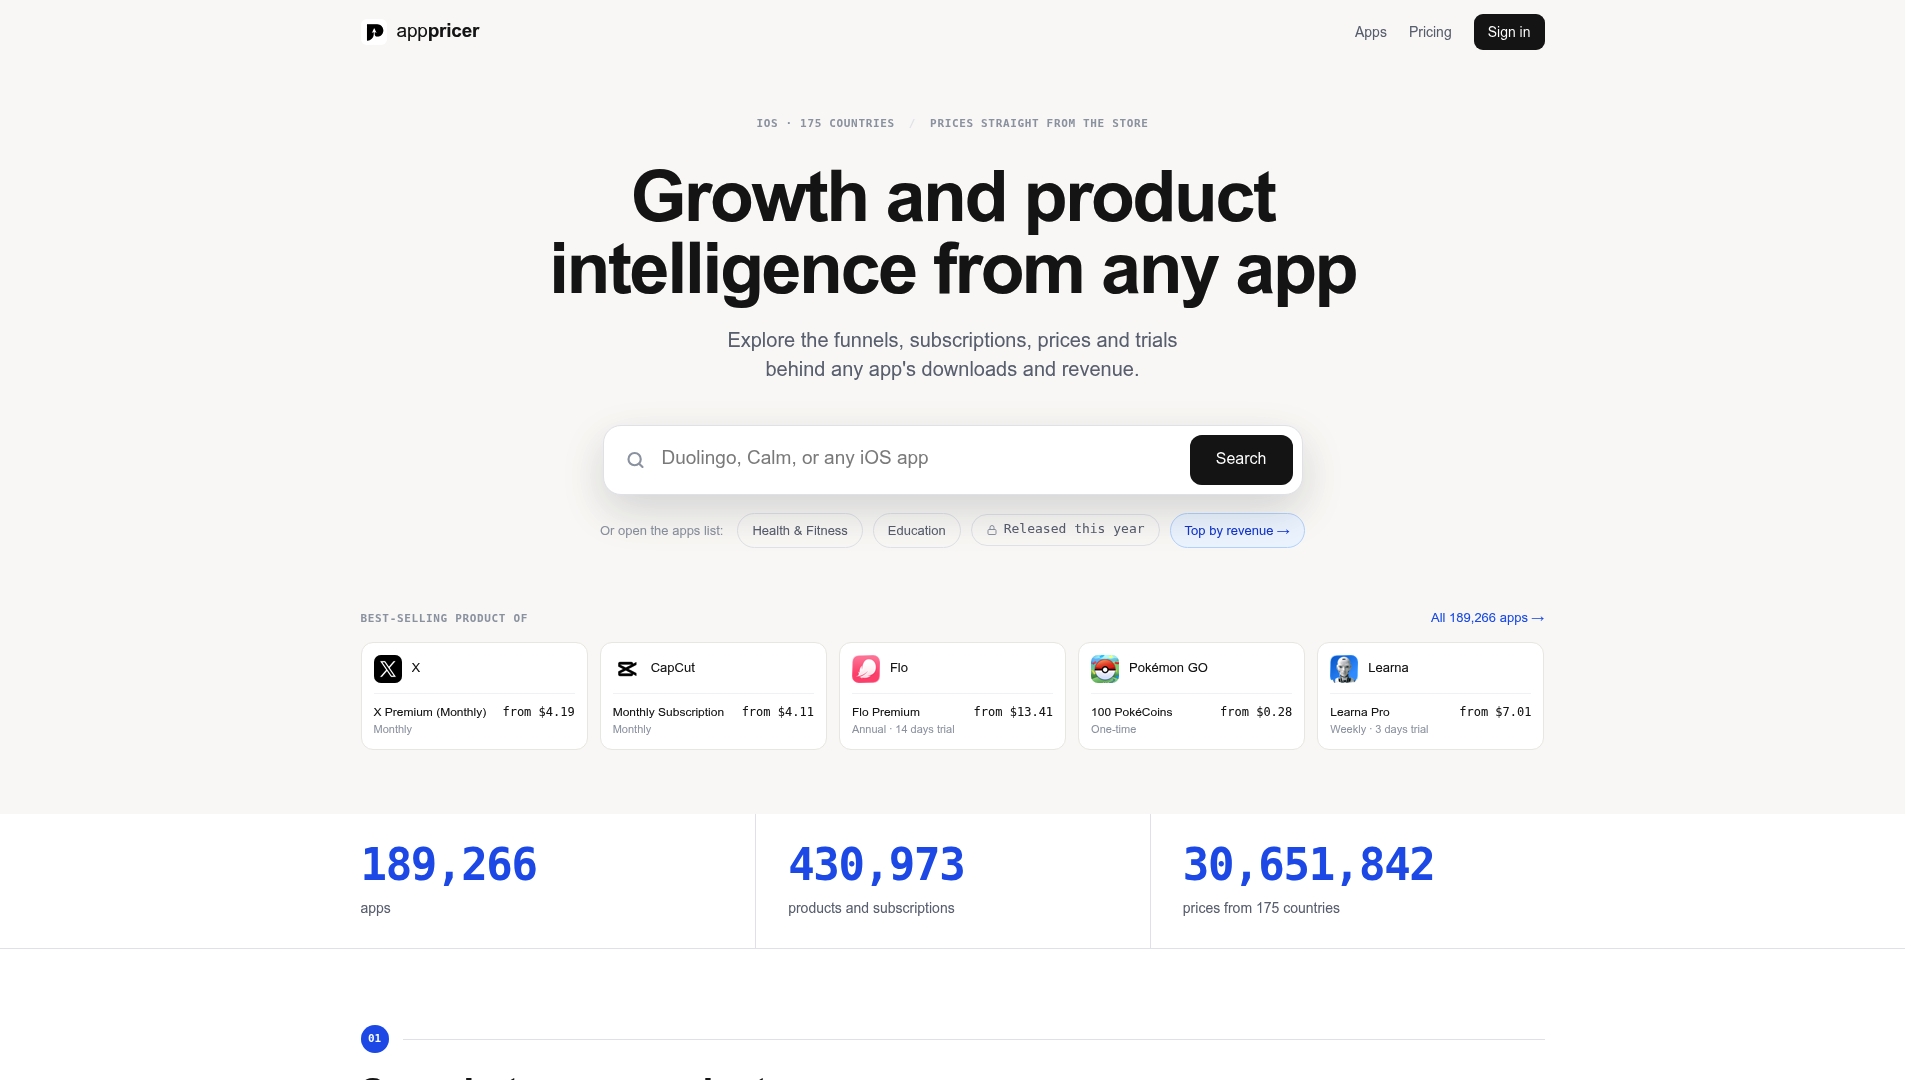
That’s the practical value here: instead of estimating what a PPP ratio should look like for a given tier, you can see what apps in your category actually charge in that market right now, and how that price holds up against download volume and revenue trends over time. For SaaS and app teams building a regional pricing analysis from scratch, that’s the difference between a benchmark grounded in real market behavior and one built on assumptions. Check the aggregated iOS pricing and subscription data for your category before you finalize your next tier, or start with the full analytics platform to see revenue projections across your target markets.
Sources
- How to use geographic pricing | Stripe
- The ultimate guide to price localization | RevenueCat
- Geographical pricing — Wikipedia
- Geographical pricing — Investopedia