How to Estimate App Revenue: A Guide for Developers and Investors

A defensible app revenue estimate comes from three ingredients: a download estimate, a country-weighted monetization benchmark (ARPU for subscriptions and in-app purchases, eCPM for ads), and store-price anchors pulled directly from the app itself. Run those three against each other, and you get a number you can actually defend in a pitch deck or a competitive review. Run just one, and you get a guess dressed up as a number.
Here’s the minimum input checklist before you touch a calculator:
- Estimated monthly downloads, broken out by country if you can get it
- Monetization mix: subscriptions, one-time purchases, ads, or some blend
- The app’s actual price list or in-app purchase catalog, pulled from the store
- Assumed conversion rate, ARPU, or eCPM benchmarks for the category
The output you’re aiming for is gross monthly revenue, net developer revenue after store fees, and a confidence tier: high, medium, or low. Apple’s own developer guidance stresses that the revenue model itself, subscription versus freemium versus paid, shapes what inputs even matter, and RevenueCat’s benchmarks offer the steady-state subscription math most estimates lean on.
The single biggest error in app revenue estimation isn’t a bad formula. It’s using one data source when you had time for two.
Key Takeaways
Estimating app revenue accurately requires combining a download estimate, country-weighted monetization benchmarks, and real store-price anchors, then checking the result against a second independent method.
| Point | Details |
|---|---|
| Triangulate, don’t guess once | Cross-check every estimate against at least two independent methods before trusting the number. |
| Country weighting changes everything | Apply ARPU and eCPM by country rather than a flat global average to avoid distorted revenue figures. |
| Separate gross from net | Always subtract the 15% to 30% store fee and state clearly whether you’re reporting gross or net revenue. |
| Anchor to real prices | Use the app’s actual published subscription and IAP prices as a fixed floor for any revenue model. |
| Apppricer tightens country inputs | Apppricer supplies real price and subscription data across 175 countries to replace guessed ARPU inputs with published ones. |
Table of Contents
- What Are Download and Revenue Estimates Actually Used For?
- How Do You Run an App Revenue Estimate Step by Step?
- What Formulas Actually Calculate App Revenue?
- How Accurate Are App Revenue Estimates, Really?
- Which Tool Fits Which Estimation Task?
- How Does Apppricer Fit Into an Estimation Workflow?
- Worked Example: Estimating a Subscription App’s Monthly Revenue
- Estimate App Revenue for Developers and Investors: What Actually Matters
- Try Apppricer for Country-Aware Revenue Inputs
- Frequently Asked Questions
- Sources
What Are Download and Revenue Estimates Actually Used For?
The method you pick should match the decision you’re making, not the other way around. A quick gut-check for ASO prioritization tolerates a wide error band. A term sheet does not.
- Competitor ASO prioritization: you’re scanning dozens of apps to find which ones are worth studying closely. Speed beats precision here.
- Market sizing: estimating total addressable revenue in a niche before building. Directional accuracy is enough.
- Business-model validation: checking whether subscription or ad-based monetization fits your user base, informed by the tradeoffs between the two.
- Pre-launch revenue projections: forecasting your own app’s income before it exists, which leans entirely on category benchmarks.
- M&A or investor triage: screening acquisition targets or portfolio companies, where a wrong number costs real money and demands triangulation across at least two independent sources.
The tighter the decision’s stakes, the tighter your error band needs to be, and the more tools you should run in parallel rather than trusting one output.
How Do You Run an App Revenue Estimate Step by Step?
This is the workflow experienced analysts actually follow, in order.
- Gather public signals. Pull the app’s store rank, review count and velocity, visible price list, in-app purchase catalog, and any A/B-tested subscription tiers you can spot across regions.
- Estimate downloads. Use rank plus review velocity, or a third-party download estimator, to build a monthly download figure, ideally broken out by top five countries. Write down every assumption as you go.
- Set the monetization mix and benchmarks. Decide the split between subscriptions, IAP, and ads, then apply ARPU or eCPM benchmarks weighted by country, since a download in Japan and a download in Brazil rarely carry the same value.
- Compute gross and net revenue. Multiply downloads by your monetization assumptions for gross revenue, then subtract Apple’s or Google’s standard 15% to 30% store fee to get net developer revenue. Present the result as a range: low, most likely, high.
- Sanity-check with a second method. Cross-reference your number against store-signal triangulation or a different vendor’s estimate, following the kind of three-method framework Mirava outlines.
- Report a confidence tier. Stop refining once your range is tight enough to support the actual decision in front of you, whether that’s a prioritization call or an investment memo.
Pro Tip: Treat the app’s own price list as ground truth, not a guess. If a competitor sells a $9.99 monthly subscription with no free tier, that number anchors your entire model, no matter what a download estimator spits out.
What Formulas Actually Calculate App Revenue?
Three formulas cover almost every estimation scenario you’ll run into. Each has a different sensitivity profile, so knowing which one to reach for matters as much as the math itself.
Downloads × Revenue Per Download (RPD) is the blunt instrument. Multiply total downloads by an assumed revenue-per-download figure for the category. It’s fast and fine for a first pass, but it hides the difference between a $50-a-year subscription app and a rewarded-video game monetizing at a fraction of a cent per session.
Subscription math works differently: active subscribers × price × (1 minus monthly churn) gives you steady-state monthly revenue. First-year projections need an extra layer, factoring in trial-to-paid conversion, which RevenueCat’s benchmark data suggests varies widely by category and trial length. A 14-day free trial with a hard paywall converts very differently than a 3-day trial with a gentle nudge.
Ad revenue math runs as: DAU × sessions per user × ads per session × (eCPM ÷ 1000) × 30 for a monthly figure. eCPMs vary hugely by format, banner ads often sit well under $5, while rewarded video can run several times higher depending on region and demand.
A worked sensitivity band matters more than a single output:
- Low scenario: conservative churn, bottom-of-range eCPM, minimal country weighting
- Median scenario: category-average benchmarks across the board
- High scenario: strong retention, premium-market country mix, top-of-range eCPM
Apply country weights before you finalize any of these. A million downloads split 70% US and 30% India monetizes nothing like a million downloads split the other way, and subscription-heavy apps in particular show outsized ARPU gaps between top-tier and emerging markets.
How Accurate Are App Revenue Estimates, Really?
Not very, if you’re relying on a single source. Every estimate carries error from four directions: download-count variance, ARPU guesswork, wrong country-mix assumptions, and price experimentation the vendor’s snapshot never caught.
That gap exists because downloads are observable through rank and review signals, while monetization mix is inferred, and inference is where estimates diverge.
A few sanity checks keep you honest:
- Anchor to the app’s actual published price and IAP list; it never lies the way a modeled ARPU can.
- Cross-check against review velocity and any category-level revenue benchmarks you trust.
- Always state whether you’re reporting gross revenue or net developer revenue after store fees. Conflating the two is the single most common error in competitive analysis.
Reconstruct the floor: multiply the app’s cheapest visible subscription price by a conservative subscriber count, and use that as your minimum plausible revenue.*
Which Tool Fits Which Estimation Task?
Not every job needs the same horsepower. A quick competitive scan and a due-diligence memo call for different tools entirely.
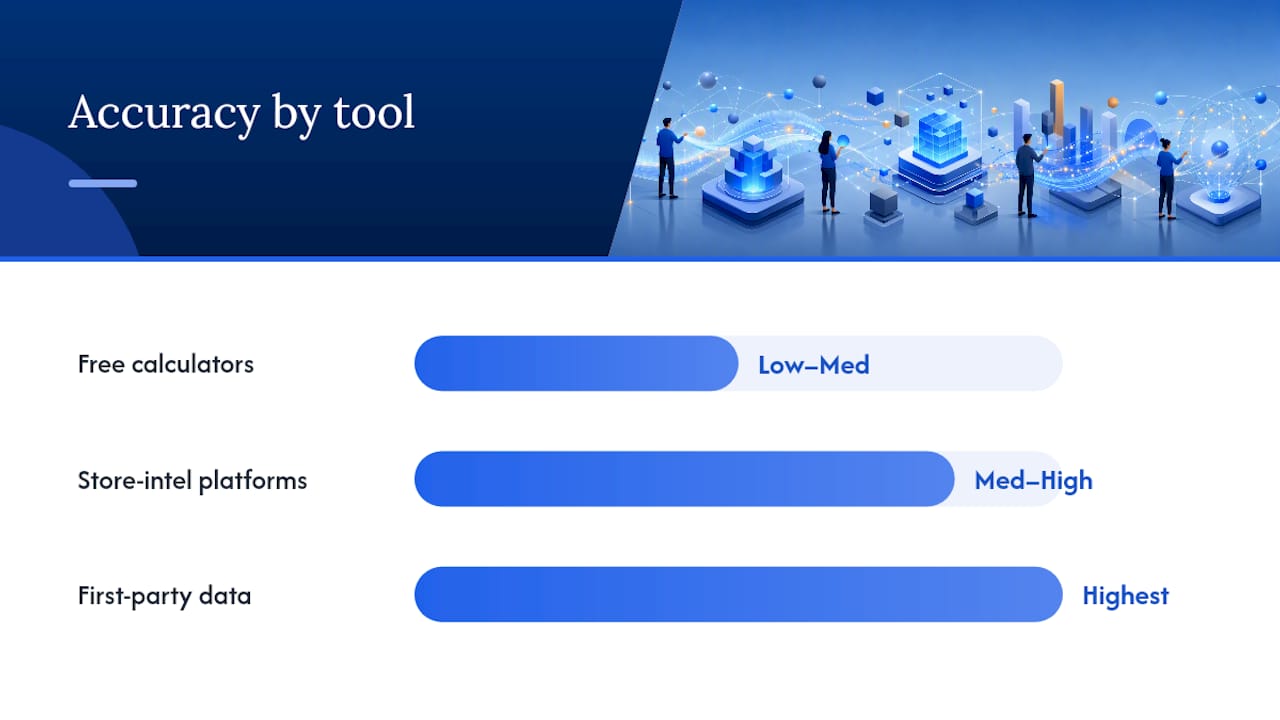
Free calculators and quick checkers are built for triage: plug in a download guess and a category benchmark, get a rough number in seconds. They’re fast but usually skip country breakdowns entirely, which flattens revenue estimates for any app with a global user base.
Store-intelligence platforms go further, layering country-level pricing and download weighting on top of category benchmarks. That’s the right tier for ASO prioritization or scanning a competitive set before you commit real analyst time.
First-party data, your own app’s actual analytics, is always the highest-fidelity input you’ll ever have, and it should anchor any forecast you build for your own product even when you’re benchmarking against competitors using estimated data.
| Approach | Accuracy/confidence | Coverage | Cost | Best for |
|---|---|---|---|---|
| Free calculators | Low to medium | Global, no country split | Free | Fast triage |
| Store-intel platforms | Medium to high | Country and store weighted | Paid | ASO and competitor prioritization |
| First-party data | Highest (for your own app) | Your actual user base | Included in your stack | Forecasting and validation |
How Does Apppricer Fit Into an Estimation Workflow?
Country weighting is where most estimates quietly fall apart, because a single global ARPU number papers over enormous pricing differences between markets. Apppricer exists to close that gap: it aggregates actual app prices and subscription structures across 175 countries, so you’re working from real published prices instead of a guessed global average.
In practice, the workflow looks like this:
- Pull the target app’s country-by-country price and subscription list from Apppricer’s tracked apps
- Apply your own ARPU or eCPM benchmarks on top of those real prices rather than an estimated one
- Recompute your revenue projection weighted by each country’s actual pricing tier and download share
- Use the same data to audit your own pricing against category leaders before you set your next price point
Pro Tip: If you’re estimating a competitor’s revenue in a market you don’t operate in, pull their local price first. A subscription priced at $9.99 in the US might list at a very different local-currency equivalent elsewhere, and that gap alone can swing your revenue estimate by a wide margin.
Worked Example: Estimating a Subscription App’s Monthly Revenue
Say you’re sizing up a mid-sized subscription app. Here are the inputs:
- Estimated monthly downloads: 40,000 in the US, 25,000 across the next four largest markets combined
- Subscription price: $7.99/month in the US, with country-adjusted pricing elsewhere
- Trial-to-paid conversion: 8% (conservative), 12% (base), 16% (aggressive)
- Monthly churn: 6% (conservative), 4.5% (base), 3% (aggressive)
That’s the sensitivity every estimate needs to show, not bury.
- Notes: active subscriber counts assume steady-state churn, not first-month cohort behavior.
- The store fee band (15% to 30%) depends on whether the developer qualifies for Apple’s or Google’s small-business rate.
- Country-adjusted pricing should come from the app’s actual published price list, not a flat currency conversion.
Estimate App Revenue for Developers and Investors: What Actually Matters
Most guides on this topic treat the formula as the hard part. It isn’t. The arithmetic behind subscription math or ad-eCPM math is something you could teach in twenty minutes. The hard part, and the part conventional advice consistently underweights, is country weighting.

I’ve seen more bad revenue estimates come from a single blended global ARPU than from any wrong formula. Treating those as interchangeable is where competitive analysis quietly goes wrong.
The second thing overrated: chasing a tighter single number instead of a wider, honest range. Investors and product leads don’t need false precision. They need to know whether the low end of your range still supports the decision. If it does, you’re done. If it doesn’t, that’s the real signal to keep digging, not the number itself.
Prioritize real price data over modeled averages every time you can get it.
Try Apppricer for Country-Aware Revenue Inputs
Every formula in this guide gets sharper the moment you swap a guessed ARPU for a real, published price. That’s the specific gap Apppricer closes: instead of estimating what a competitor charges in Germany or Brazil, you pull the actual price and subscription tier they’ve listed there.
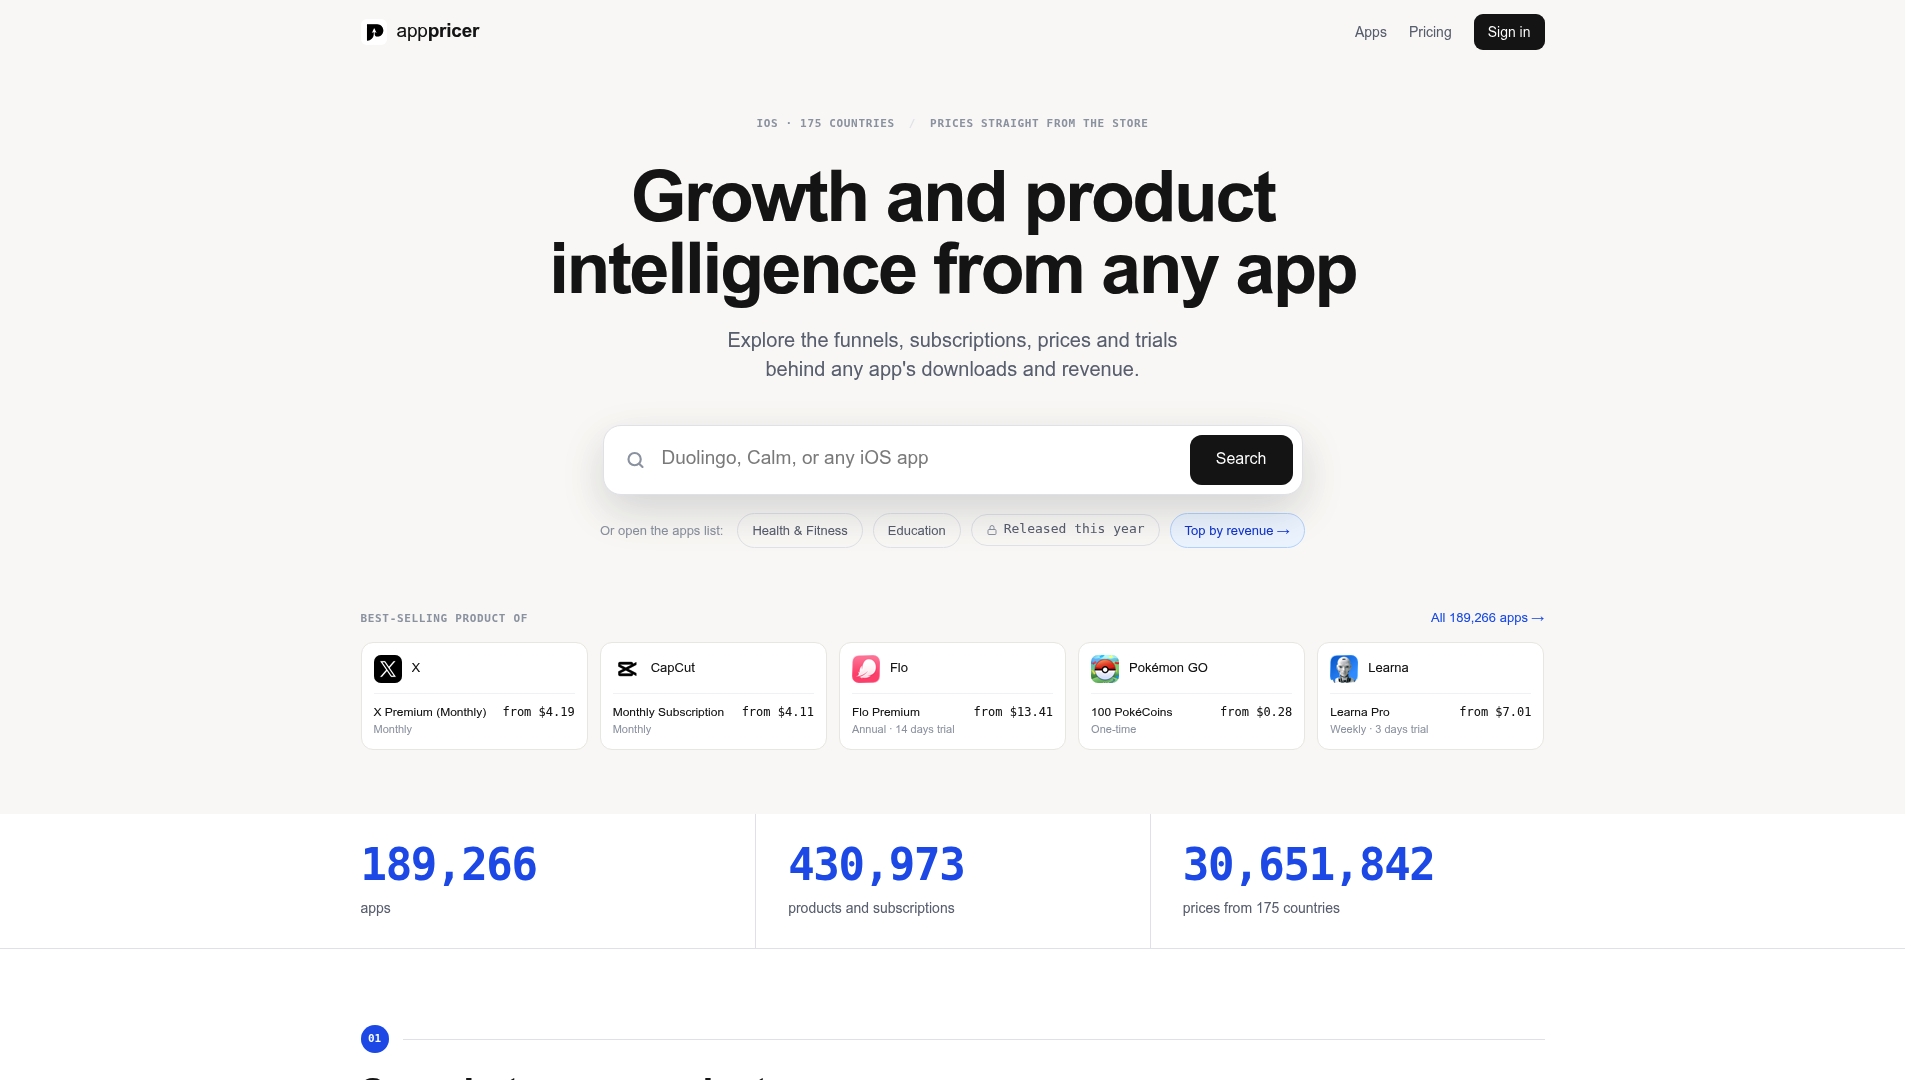
Apppricer tracks pricing and subscription data across 175 countries, giving you the country-by-country inputs that turn a rough revenue range into something you can defend in a competitive review or an investment memo. Pull a target app’s full country price and subscription breakdown, plug it into the formulas above, and recompute your estimate with real numbers instead of assumptions. Start with the Apppricer product page to see what a country-aware pricing input actually looks like before your next estimate.
Frequently Asked Questions
What’s the fastest way to estimate app revenue? Multiply an estimated download count by a category revenue-per-download figure. It’s rough, useful for a first-pass triage, but it ignores country and monetization-mix differences that can swing the real number substantially.
How do I calculate app revenue for a subscription app? Multiply active subscribers by price, adjusted for monthly churn, to get steady-state monthly revenue. For a first-year projection, layer in trial-to-paid conversion rates, which vary by trial length and category.
What’s the difference between gross and net app revenue? Gross revenue is total money collected from users.
How accurate are third-party app revenue estimators?
Why does country weighting matter so much for revenue estimates? ARPU and eCPM vary significantly by country. A flat global average hides that a download in one market might be worth several times more than a download in another, distorting any revenue projection that ignores it.
Sources
For monetization model tradeoffs, Apple’s Developer guidance is the starting point. For subscription math specifically, RevenueCat’s calculator and benchmarks cover steady-state and trial-conversion arithmetic. For a broader monetization taxonomy, Emergent’s revenue models explainer is a solid reference, and Mirava’s three-method guide walks through triangulation in more depth.
- App Store business models | Apple Developer
- App store revenue calculator | RevenueCat
- How Do Apps Make Money? 9 Revenue Models Explained | Emergent
- App Revenue Models: Which One Actually Works | Alex Berman
- How to Check Any App’s Revenue: 3 Methods (2026) | Mirava