Avoid Costly Growth Team Mistakes: ARPU vs ARPPU and Payer %

ARPU measures average revenue across every active user and guides acquisition ROI decisions. ARPPU measures average revenue only among paying users and guides pricing and upsell decisions. Check ARPU when you’re deciding where to spend acquisition budget or judging overall monetization health, and check ARPPU when you’re testing a price change or evaluating payer segments. Neither metric works alone. You need both, alongside your conversion rate, to see the full unit-economics picture.
TL;DR:
- ARPU should be analyzed alongside ARPPU to accurately assess overall monetization and payer behavior, especially when evaluating acquisition channels.
- High ARPPU with low ARPU indicates conversion issues, while rising ARPPU with declining payers suggests a shrinking revenue base, requiring different strategies.
- Calculations must align with consistent time windows and exclude refunded transactions to prevent skewed data, especially from high-spenders.
- Benchmarking ARPU and ARPPU against actual market data helps set realistic goals for pricing, subscription tiers, and revenue growth strategies.
- Segmenting metrics by cohort and channel, and reporting payer percentages alongside revenue figures, prevents misinterpretation and supports sound decision-making.
Table of Contents
- ARPU vs ARPPU: Definitions and Formulas
- How Do ARPU and ARPPU Differ in Practice?
- Worked Examples: Calculating ARPU and ARPPU
- Using ARPU and ARPPU Together for Growth Decisions
- Common Measurement Pitfalls and How to Avoid Them
- What I’ve Learned Watching Teams Misread These Numbers
- How Apppricer Helps You Benchmark ARPU and ARPPU
- Sources
ARPU vs ARPPU: Definitions and Formulas
ARPU (Average Revenue Per User) equals total revenue divided by total active users in a given period. Investopedia defines it as a core measure of overall monetization effectiveness, and it’s the number most teams cite when comparing marketing channels or reporting to investors.
ARPPU (Average Revenue Per Paying User) equals total revenue divided by the number of paying users in that same period. CFI’s formula isolates what your actual customers spend, stripped of the free-riding majority that ARPU includes. Unity’s glossary makes the same distinction explicit: ARPPU calculations should exclude revenue attributable to non-paying users entirely, since mixing the two defeats the point of the metric.
A few counting rules determine whether your numbers mean anything:
- Active user: define this the same way your analytics platform does, whether that’s DAU or MAU, and never switch definitions mid-analysis.
- Paying user: typically anyone who completed a subscription payment, in-app purchase, or one-time transaction within the period, though some teams separate subscribers from one-off buyers.
- Ad revenue: decide upfront whether it counts toward the ARPU numerator. Including it inflates ARPU for ad-supported apps and makes cross-app comparisons unreliable if one app monetizes only through IAP.
- Time window alignment: the numerator and denominator must cover the identical period. Revenue from March divided by active users from April produces a number that looks precise and means nothing.
How Do ARPU and ARPPU Differ in Practice?
ARPU tells you monetization reach. It answers whether your product converts its total user base into revenue efficiently, which makes it the right lens for judging acquisition source ROI or comparing overall product health year over year.
ARPPU tells you payer depth. It answers what your customers who actually pay are worth, which makes it the metric to watch when you raise prices, launch a premium tier, or test an upsell flow.
The two metrics diverge in ways that reveal specific problems:
- High ARPPU, low ARPU: your paying users spend well, but too few users convert. That’s a conversion or onboarding problem, not a pricing problem.
- Rising ARPPU, falling paying-user count: your remaining payers spend more on average, but you’re losing payers faster than they’re spending more. CFI warns this exact pattern can mask a shrinking revenue base behind a metric that looks like it’s improving.
- Both flat, but total revenue growing: your user base is growing at the same rate as revenue, which is fine, but it means neither pricing nor conversion is doing extra work.
Statistic to remember: Benchmark ranges swing wildly by category. Some free-to-play app categories run monthly ARPU under a dollar while ARPPU among their payers can be many multiples higher, according to Statista’s breakdown of free and paid Android apps. Comparing your ARPU against a generic industry average across categories is close to meaningless.
Worked Examples: Calculating ARPU and ARPPU
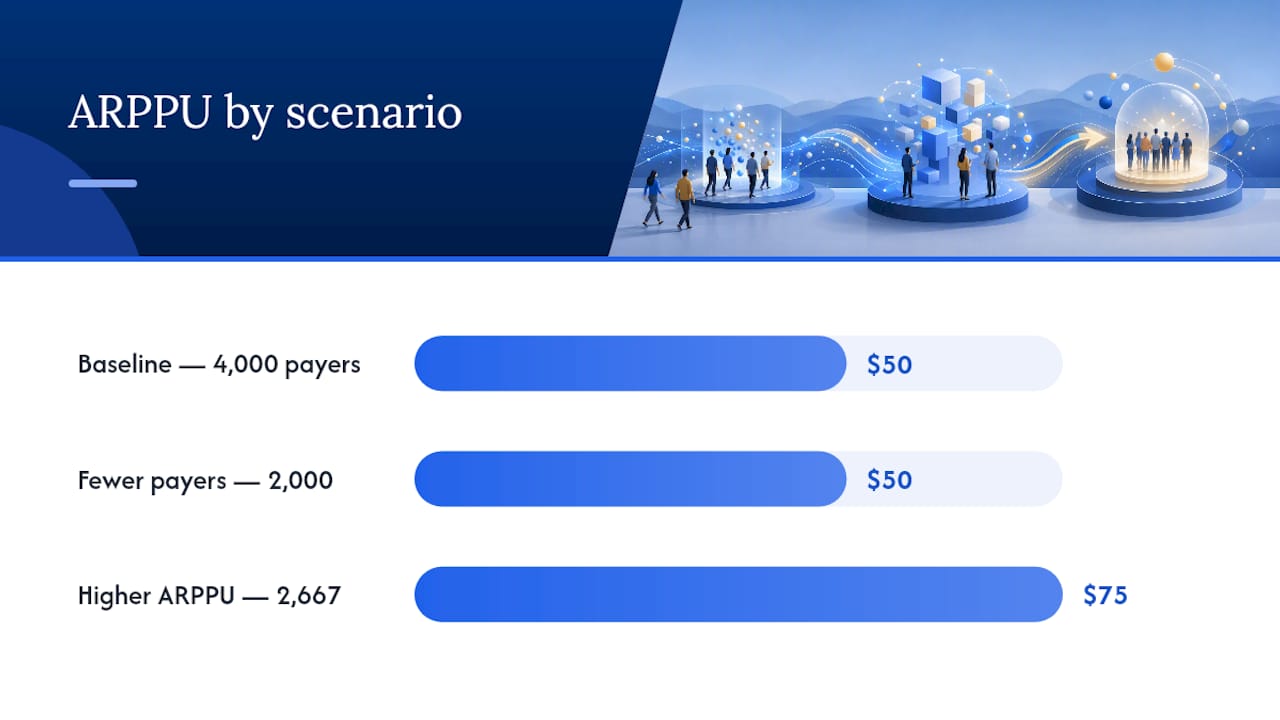
Example 1. Say your app had 100,000 active users last month and generated $200,000 in revenue, with 4,000 of those users making a payment.
- ARPU = $200,000 ÷ 100,000 = $2.00 per active user
- ARPPU = $200,000 ÷ 4,000 = $50.00 per paying user
- Conversion rate = 4,000 ÷ 100,000 = 4%
Multiply ARPPU by conversion rate and you get ARPU back: $50 × 0.04 = $2.00. This relationship is why you never read one metric without the other.
Example 2. Now imagine two scenarios starting from the same baseline.
Paying users drop to 2,000, revenue falls to $100,000, ARPPU stays at $50, and ARPU drops to $1.00. Your monetization efficiency per payer is unchanged, but your overall product economics just got worse.
Revenue lands around $200,000 (2,667 × $75), ARPPU jumps to $75, and ARPU holds close to $2.00. Same total revenue, healthier ARPPU, and now you know pricing power exists in your payer base.
Both examples assume clean data: exclude refunded transactions, chargebacks, and internal test purchases before running either formula, or your numerator will overstate real revenue.
Using ARPU and ARPPU Together for Growth Decisions
Run ARPU by acquisition channel and by cohort, typically at 30, 60, and 90 days out, to separate channel quality from raw volume. Mixpanel’s guidance on ARPU stresses that cohort analysis and user-level attribution are what make the metric actionable rather than a vanity number reported once a quarter. A channel that brings cheap users with low ARPU might still beat an expensive channel if its cohort ARPU compounds faster by day 90.
Use ARPPU specifically to validate pricing and upsell experiments, but never read it alone. AppsFlyer’s glossary entry recommends tracking ARPPU next to payer percentage so a pricing win among your existing payers doesn’t hide a conversion problem on the front end.
Before scaling any acquisition channel, tie your ARPU numbers into LTV and CAC. If channel ARPU projects an LTV below 3x your CAC, the channel isn’t ready to scale regardless of how good the raw ARPU looks in isolation.
- Segment ARPU by channel and cohort window, not just as a single blended number.
- Pair every ARPPU report with payer % and mean ARPU side by side.
- Confirm user-level revenue attribution exists before trusting either metric for a spend decision.
Pro Tip: Build a simple dashboard row that shows ARPU, ARPPU, payer %, and median payer revenue together. If you can only see one number at a time, you’ll misread the story roughly half the time.
Common Measurement Pitfalls and How to Avoid Them
The most common distortion is whale-driven skew. A handful of high-spending users can drag ARPPU upward while the typical payer’s experience hasn’t changed at all. Reporting median payer revenue alongside the mean catches this before it leads you into a pricing decision based on outliers.
Mismatched time windows are the second most common error, usually from pulling revenue from a billing system and active-user counts from an analytics tool that closes its periods differently. Refunded transactions counted as revenue is the third: a spike in refunds after a price increase can make ARPPU look stable while real, kept revenue is falling.
Best practices to lock in:
- Fix one definition of “paying user” and use it everywhere, including in board decks and channel reports.
- Align every numerator and denominator to the identical time window before dividing.
- Attribute revenue at the user level so cohort and channel splits are actually possible.
- Report ARPU next to conversion percentage and cohort age, never as a bare number.
What I’ve Learned Watching Teams Misread These Numbers
Most teams treat ARPU and ARPPU as a single “revenue per user” concept with two flavors, and that’s the mistake. They measure entirely different things: one is about how well you convert, the other about how well you monetize once conversion happens. Confusing the two leads to fixing pricing when the real problem is onboarding, or vice versa.
My working checklist: define “paying user” once and never redefine it mid-quarter, align every time window before you divide anything, slice ARPU by cohort and channel before trusting a blended number, report payer percentage every time you cite ARPPU, and sanity-check both against median payer revenue and LTV before making a spend decision.
Aggregated pricing and subscription data across markets shortens the benchmarking step considerably. Instead of guessing what a healthy ARPPU looks like for your category, you can see what comparable apps actually charge and how their subscription tiers are structured, which turns a guess into a testable hypothesis.
— Sergey
How Apppricer Helps You Benchmark ARPU and ARPPU
Once you know your own ARPU and ARPPU, the next question is always the same: how do those numbers compare to apps actually competing for your users? Apppricer aggregates real pricing data, subscription structures, and revenue trends across 175 countries, so instead of estimating what a “good” ARPPU looks like in your category, you can see what similar apps charge and how they structure trials, tiers, and upsells.

That data maps directly onto the workflow above. Before you run a pricing experiment to move ARPPU, check the pricing and subscription models competitors in your niche are already using, so your hypothesis starts from evidence rather than a guess. For a broader illustration of how payer value shifts can distort revenue trends when they mask a shrinking user base, external data like OpenAI’s revenue statistics makes the same point at a much larger scale. Explore the Apppricer platform to start benchmarking your ARPU and ARPPU against real market data today.