Raise Day 30 RPI: App Store Pricing Policy for App Teams

Start with a three-tier structure, anchor the annual plan as your value option, localize price points by market, and judge every change by revenue per install at Day 30/60 and cost per subscriber by channel, not same-day conversion. Pull your category’s median price, instrument CPS tracking now, and schedule a controlled experiment within 30 days. Competitor pricing and subscription model data tools give you the benchmark to start from instead of guessing.
TL;DR:
- Most apps anchor prices at $9.99 despite the median in categories being closer to $6.68, indicating many competitors are testing higher price points to boost revenue.
- Leading with annual subscriptions enhances retention, with 12-month retention rates roughly 2.5 times higher than monthly plans and nearly 13 times higher than weekly plans.
- Setting three-tier plans with 15 to 30% jumps from entry to mid and 50 to 100% from mid to premium, while discounting annual plans by 15 to 20%, optimizes perceived value and conversions.
- Running short trials of 3 to 7 days on the primary paywall, combined with targeted longer trials or discounts for those who bounce, maximizes activation and reduces involuntary churn.
- Using revenue per install and cost per subscriber at Day 30 and Day 60, segmented by channel and country, enables accurate evaluation of pricing experiments beyond initial conversion metrics.
Table of Contents
- What Do App Store Pricing Policy Benchmarks Tell You?
- Should You Lead With Weekly, Monthly, or Annual Plans?
- How Should You Structure Tiers and Price Points?
- What Trial Length and Paywall Pattern Should You Use?
- How Do You Measure and Judge a Pricing Test?
- When Should You Localize Pricing by Country?
- What I’d Actually Do With This Data
- How Apppricer Turns Benchmarks Into Your Next Price Test
- Sources
- FAQ
What Do App Store Pricing Policy Benchmarks Tell You?
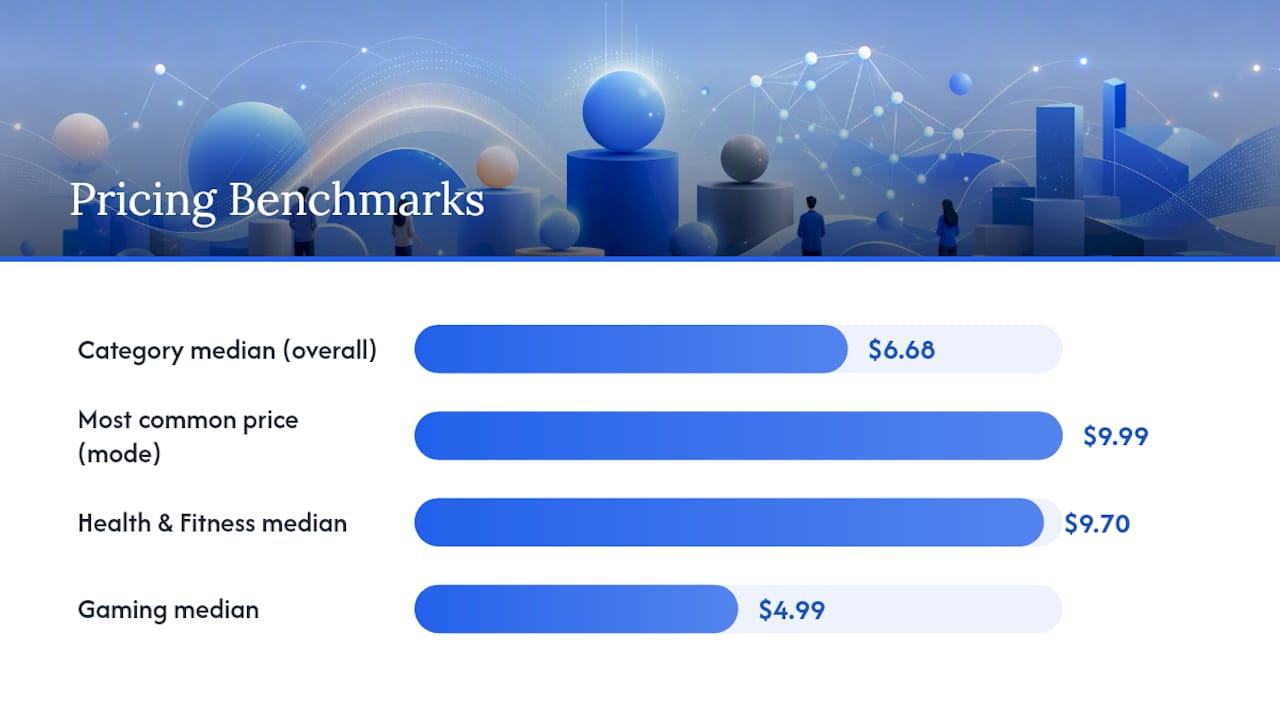
The gap between “median price” and “most common price” in your category is the first thing most teams get wrong. The monthly median subscription price sits around $6.68, but the most common monthly price point is $9.99. That’s not a rounding quirk. It means a huge cluster of apps anchor at $9.99 simply because competitors already do, which pushes the modal price into the top quartile while the median gets dragged down by cheaper long-tail apps.
Category matters more than the blended average. Health and Fitness apps run a monthly median near $9.70, while Gaming apps cluster closer to $4.99. If you’re pricing a meditation app against a $4.99 gaming benchmark, you’re leaving money on the table.
Here’s how to turn benchmark data into an actual starting price:
- Pull the 25th, 50th, and 75th percentile prices for your exact category, not the app store as a whole.
- Set your entry tier near the 25th to 50th percentile.
- Set your mid-tier near the modal or 75th percentile, since that’s where competitor demand has already validated willingness to pay.
- Reserve a premium tier 50 to 100% above mid for power users and annual bundles.
Statistic Callout: The most common monthly app subscription price is $9.99, even though the true category median runs closer to $6.68. That spread is your signal that most apps are anchoring, not testing.
Use this percentile spread as your first A/B test variant set. Test one price above your calculated median and one below it, rather than guessing at round numbers.
Should You Lead With Weekly, Monthly, or Annual Plans?
Billing period is a retention lever disguised as a pricing decision. Annual subscribers retain dramatically better than monthly or weekly ones.
Statistic Callout: Annual retention at 12 months (44.1%) outpaces monthly (17.5%) by roughly 2.5x and weekly (3.4%) by nearly 13x, according to Airbridge’s 2026 benchmark data.
That gap compounds into lifetime value fast, which is why leading apps push annual as the default even when weekly looks cheaper on the paywall.
- Weekly plans win for low-commitment categories: casual games, one-time utility tools, short-term challenges.
- Monthly plans work as a middle rung for apps still proving ongoing value.
- Annual plans should anchor the paywall for habit-forming categories: health tracking, productivity, language learning, finance.
One catch: your acquisition channel shapes which billing period converts. Apple Search Ads traffic tends to skew toward annual commitments, while Meta-driven traffic skews weekly or monthly. That means you can’t judge a price change fairly without breaking cost per subscriber down by channel.
How Should You Structure Tiers and Price Points?
Three tiers beat two or four almost every time, because “good, better, best” gives users an anchor to compare against instead of a binary yes/no decision. The math behind the jumps matters as much as the tier count itself.
- Entry to mid tier: price the jump 15 to 30% higher. Too small and users default to entry; too large and mid looks like a scam.
- Mid to premium tier: price the jump 50 to 100% higher, since premium buyers are already sold on value and respond to bigger perceived upgrades.
- Annual discount: price it 15 to 20% below the monthly-times-12 equivalent, which is enough of a nudge without gutting your monthly revenue.
Round-number thresholds still matter psychologically. $4.99, $9.99, and $19.99 remain the dominant clusters because users mentally categorize “under $5,” “under $10,” and “under $20” differently, even when the real price difference from $9.49 is trivial.
On the paywall itself, highlight the annual plan visually, show its effective monthly cost in smaller text beneath the headline price, and keep the feature comparison scannable with three columns, not a wall of text.
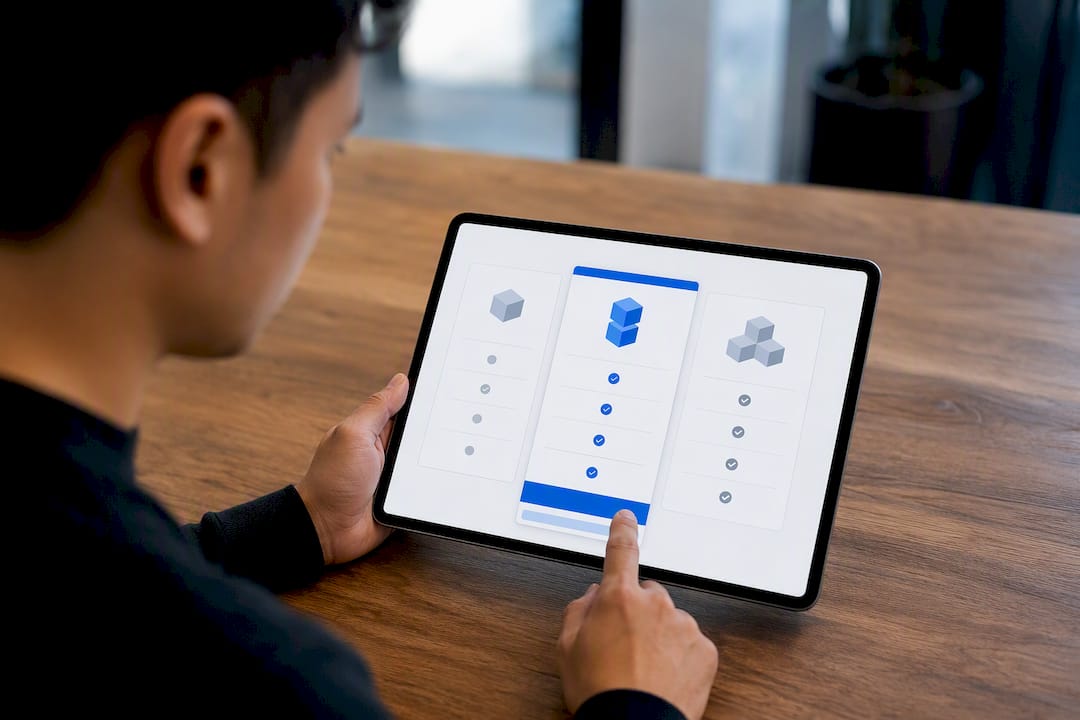
Pro Tip: Test which plan is pre-selected by default before you test the prices themselves.
Start your first experiment on the anchor tier, then move to the price gap between tiers, then finally test the raw price points.
What Trial Length and Paywall Pattern Should You Use?
Short trials, typically 3 to 7 days, have become the industry default because they accelerate activation without giving users weeks to forget why they downloaded the app in the first place. Long trials, by contrast, still have a place: attaching a 14 or 30 day trial exclusively to the annual plan nudges undecided users toward the higher-value commitment without discounting your monthly price for everyone.
The pattern that’s winning in 2026 pairs a short trial on the primary paywall with a longer trial-on-annual offer reserved for users who bounce off that first screen.
- Show the short trial (3 to 7 days) on the initial hard paywall to filter for real intent.
- Reserve the longer trial or a discount exclusively for an exit-intent or post-close offer.
- Target that offer only at users who close the paywall without converting, not everyone.
- Build in a grace period and retry logic for failed payments to cut involuntary churn, a lever often overlooked next to acquisition tactics.
Hard paywalls (no free browsing until you pick a plan) convert fewer people up front than soft paywalls, but the subscribers they do produce carry meaningfully higher lifetime value. Soft paywalls widen the funnel; hard paywalls filter for buyers.
Pro Tip: A 24-hour post-close discount recovers price-sensitive users who almost converted, without training your full-price buyers to wait for a deal.
How Do You Measure and Judge a Pricing Test?
Same-day conversion is the wrong scoreboard. Price experiments improve long-term LTV in roughly 46% of tests, but improve immediate conversion in only about 28% of them, according to Airbridge’s benchmark analysis. If you kill a test because day-one conversion dipped, you’ll throw away most of your winners.
Judging by conversion alone means missing most of your real wins.
Two metrics should anchor every pricing decision:
- Revenue per install (RPI): total subscription revenue generated by a cohort divided by installs, measured at Day 30 and again at Day 60 to capture renewal behavior, not just the initial purchase.
- Cost per subscriber (CPS): paid acquisition spend divided by subscribers won, calculated separately for every channel since billing-period mix varies by traffic source.
Structure the experiment properly before you launch it. Pre-register your success threshold (a specific RPI uplift, not “we’ll know it when we see it”), run the test long enough to capture a full D30 and D60 window, and segment results by billing period, not just by variant. Teams that run structured pricing experiments consistently outperform peers who ship price changes and never formally measure them.
The most common mistake: comparing Variant A’s conversion rate to Variant B’s conversion rate on Day 1 and calling it done. Wait for the cohort to mature.
When Should You Localize Pricing by Country?
Purchasing power parity pricing adjusts your price down in markets where local income is lower relative to your home market, which lifts conversion in those countries without necessarily cutting into revenue elsewhere. It works because a $9.99 subscription that feels routine in the United States can represent a much bigger share of disposable income in other markets.
Markets that most often warrant manual overrides rather than pure auto-adjustment: India, Brazil, Indonesia, and Mexico. Teams that implement PPP-adjusted pricing in these markets frequently see a meaningful lift in total global revenue rather than a simple shift of the same revenue to lower price points.
A short implementation checklist:
- Pull your category’s price data by country using a tool built for that, rather than a spreadsheet of guesses.
- Set manual price tiers for the four markets above instead of trusting default currency conversion.
- Run the localized price for a full billing cycle before judging results.
- Track RPI by country separately, since a “cannibalized” market on paper often nets out positive globally.
What I’d Actually Do With This Data
Most teams treat pricing as a one-time decision instead of an ongoing experiment, and that’s the real gap between apps that grow revenue and apps that plateau. Here’s the sequence I’d run in the next 30 to 90 days: pull category benchmarks first, instrument your subscription funnel so CPS and RPI are tracked by channel and billing period, then run one prioritized price experiment with a pre-registered D30/D60 success threshold.
Get finance, growth, and product aligned before you touch a live price. You need agreement on what “win” means before the data comes in, not after. The minimal event set is simple: install, trial start, paywall view, conversion, and renewal, each tagged by channel and country.
— Sergey
How Apppricer Turns Benchmarks Into Your Next Price Test
This platform provides access to real competitor prices and subscription structures, aggregated across multiple countries, so you’re not testing blind. Instead of guessing at a category median, you pull actual price and download trend data for the apps already winning in your niche, then use it to set entry, mid, and premium tiers with real market evidence behind each one.
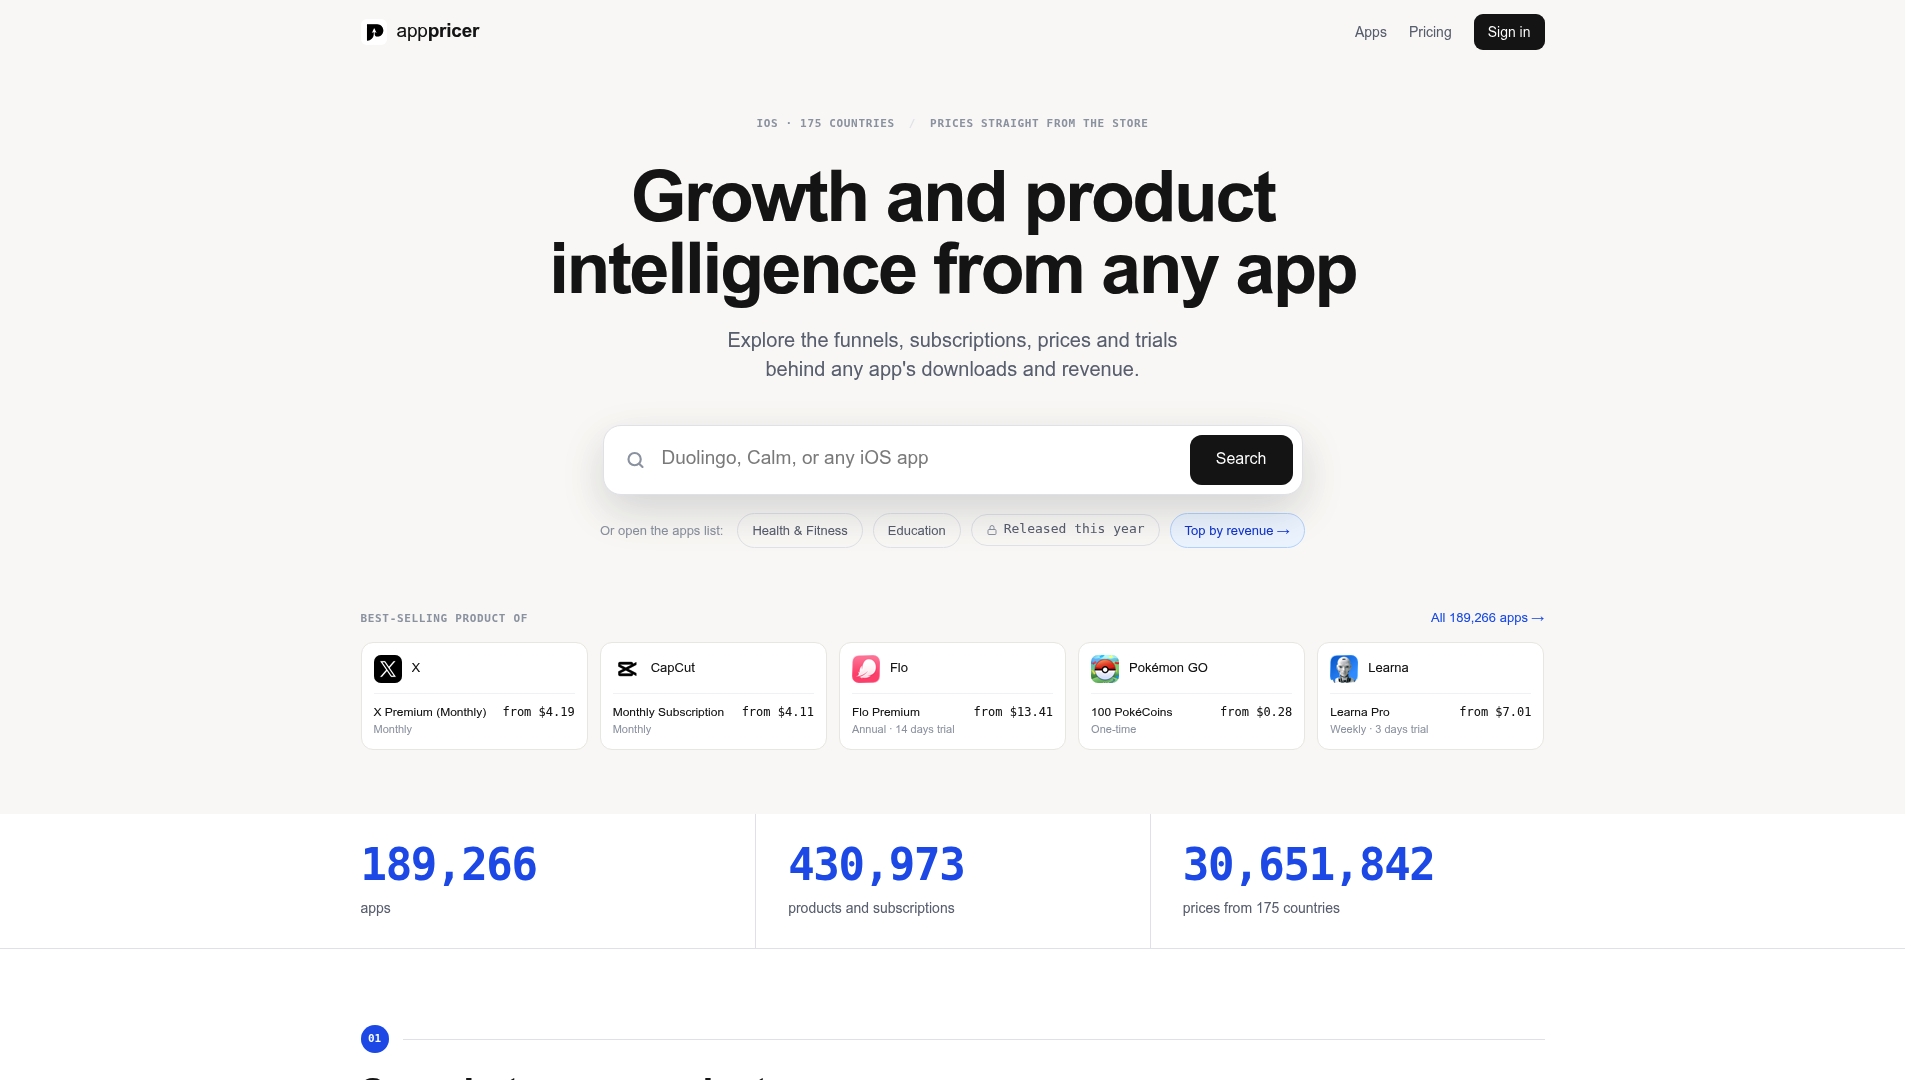
Such platforms aggregate real app prices and subscription models rather than estimates, which means you can see how competitors structure their weekly, monthly, and annual tiers before you build your own paywall. Browse live competitor pricing and subscription data for any category you’re entering, or pull revenue and download trend data to validate a niche before you commit engineering time to it. API access lets you feed that same competitor data directly into your own experiment dashboards.
Start by checking your category’s current price landscape on Apppricer’s app intelligence platform before you schedule your next pricing test.
Sources
For deeper category data, review Adapty’s State of In-App Subscriptions for trial and paywall trends, Airbridge’s subscription pricing benchmark for category medians, and LaunchShots’ pricing math breakdown for tier-jump guidance. Business of Apps also publishes broader market sizing worth cross-referencing against your own category assumptions.
- Subscription app pricing by category 2026 benchmark — Airbridge
- What does a high-performing paywall look like in 2026? — Adapty blog
- App Subscription Pricing 2026: $4.99 vs $9.99 vs $19.99 Math — LaunchShots
FAQ
What’s the difference between RPI and conversion rate?
Revenue per install (RPI) measures total subscription revenue divided by installs at Day 30 or 60, capturing renewals; conversion rate only measures whether someone purchased on day one, which misses most winning price tests.
How long should a free trial be?
Most apps now run short trials of 3 to 7 days on the primary paywall to accelerate activation, reserving longer trials as a targeted offer for users who don’t convert immediately.
Should I lead with weekly, monthly, or annual billing?
Lead with annual for habit-forming categories since it drives dramatically higher 12-month retention, and reserve weekly or monthly plans for lower-commitment categories like casual games or short-term tools.
How do I know if PPP pricing is worth it for my app?
Test manual price overrides in high-volume, price-sensitive markets like India, Brazil, Indonesia, or Mexico for a full billing cycle, then compare country-level RPI rather than assuming it cannibalizes other markets.
Where can I find real competitor pricing data instead of estimates?
Apppricer aggregates actual subscription prices, billing structures, and download trends across multiple countries, giving you live competitor price data to benchmark against instead of relying on category averages alone.