US Leads With $317B: App Revenue by Country and Where Price Tests Win

The United States, China, and Japan lead global app revenue by a wide margin, with the US alone projected at $317.39 billion in 2026 out of a worldwide app market Statista pegs near $739.61 billion. Subscriptions and in-app purchases drive most of that spend in mature markets, while advertising fills the gap in high-install, lower-ARPU regions. These figures come from 2025 and 2026 forecasts published by Statista, Sensor Tower, and Business of Apps.
TL;DR:
- The US dominates app revenue with high ARPU, especially on iOS, while China’s revenue is split across various app stores, not just Google Play.
- Japan has among the highest per-capita gaming spend, driven by loyalty to card and RPG titles, despite a smaller population.
- Android accounts for most installs outside of wealthy markets but generates significantly less revenue per user compared to iOS.
- App revenue sources vary: games dominate in many countries, while subscriptions and ads drive revenue in Western markets and emerging regions respectively.
- Local payment infrastructure and regulation heavily influence actual revenue potential, often more than market size or rankings suggest.
Table of Contents
- App Revenue by Country: The Top Markets Ranked
- iOS vs Android vs China: How Store Ecosystems Split Revenue
- Where App Revenue Comes From: Games, Subscriptions, IAP, and Ads
- App Revenue Trends Through 2029: Where Growth Is Concentrating
- Turning Country Revenue Data Into Market Decisions
- What Apppricer Adds to Public Market Reports
- How Regulation and Local Economics Shape Country Revenue
- Why App Spending Habits Differ So Much by Culture and Demographics
- How Currency Swings Distort Reported App Revenue
- ARPU by Country: The Real Measure of Monetization Efficiency
- How Payment Method Availability Shapes App Revenue
- The Real Lesson in Country Revenue Data
- Get Country-Level Pricing Data Without the Guesswork
- Sources
- FAQ
App Revenue by Country: The Top Markets Ranked
Ranking countries by app revenue only tells half the story. The more useful question for an analyst is why each market lands where it does, because the drivers behind a number determine whether that market is worth entering, testing, or ignoring.
The United States sits well ahead of every other market, and Statista’s country data confirms China and Japan round out the top three for in-app revenue. Below is a directional picture of where the top markets stand and what shapes each one.
| Rank | Country | Primary revenue driver | Notable characteristic |
|---|---|---|---|
| 1 | United States | Subscriptions, IAP, mobile gaming | Largest single-country market; high iOS ARPU |
| 2 | China | Games, super-app ecosystems | Revenue split across Android and third-party app stores |
| 3 | Japan | Mobile gaming (gacha mechanics) | Exceptionally high per-capita spend in games |
| 4 | United Kingdom | Subscriptions, entertainment apps | Strong iOS penetration relative to population |
| 5 | South Korea | Gaming, messaging platforms | Heavy concentration in a handful of top-grossing titles |
| 6 | Germany | Utility and productivity subscriptions | Price-sensitive market with strong Android share |
| — | Brazil | Ad-driven apps, fintech | Fast-growing IAP base, per-user spend still low |
| 8 | France | Entertainment, subscription media | Balanced iOS/Android revenue split |
| — | Canada | Subscriptions, cross-border app usage | ARPU close to the US but a smaller total base |
| 10 | India | Ad monetization, freemium games | Massive install base, among the lowest ARPU globally |
A few things stand out once you look past the ranking itself.
- Japan’s revenue per capita in mobile gaming remains among the highest in the world, driven by loyal spend in card and RPG titles rather than sheer population.
- Brazil and India show the sharpest install-to-revenue gap: enormous download volume paired with modest per-user spend, which is common in ad-supported markets.
- The United Kingdom and Canada punch above their population size because of strong iOS adoption and subscription habits similar to the US.
- Business of Apps’ country-level leaderboards show apps like TikTok and Google One recurring near the top of grossing charts across multiple countries, which signals how much cross-border demand concentrates in a small number of global products.
Market scope matters here too. Statista’s own methodology documentation defines the app market as consumer spend across major app stores, which excludes some regional or sideloaded app ecosystems, particularly in China. Keep that scope in mind before comparing figures across sources; two reports measuring slightly different store universes will never match exactly.
iOS vs Android vs China: How Store Ecosystems Split Revenue
Platform mix changes what a country’s headline revenue number actually means, and this is where a lot of market comparisons go wrong. A country with a huge Android install base and a country with a smaller but wealthier iOS base can post similar total revenue while representing completely different monetization realities.
iOS consistently produces higher revenue per user than Android, even though Android wins on raw installs almost everywhere outside a handful of wealthy markets. Industry benchmarks put average iOS spend per user near $12.77 compared to $6.19 on Android, a gap wide enough that it shapes almost every country comparison in this space.
A few patterns worth tracking when you evaluate store composition by country:
- The US, UK, Japan, and Australia show disproportionately high iOS revenue share relative to their iOS install base, a sign of strong subscription and IAP habits among iPhone owners.
- Android dominates install volume in India, Indonesia, Brazil, and most of Southeast Asia, but converts a much smaller share of those installs into paid spend.
- China’s ecosystem breaks the usual iOS/Android framework entirely. Android app distribution runs largely through third-party stores like Huawei AppGallery, Tencent MyApp, and Xiaomi’s GetApps rather than Google Play, which is not available there. That splits reported revenue across store operators in ways Western analysts often underestimate.
- Comparing “Android revenue” across countries without accounting for China’s store fragmentation produces misleading totals, since a large share of Chinese Android spend never touches a single unified dataset the way US or European Android revenue does.
For analysts building country comparisons, the practical fix is to separate store share from monetization efficiency. A country can have low iOS penetration and still generate strong iOS revenue if the iPhone-owning segment happens to be an app’s target demographic.
Where App Revenue Comes From: Games, Subscriptions, IAP, and Ads
Segment mix explains more variance in country revenue than almost any other factor, and it’s the piece analysts skip most often when they just glance at a total revenue figure.
- Mobile gaming dominates overall app spend in most markets. Games generate the largest single share of app revenue in countries from Japan to South Korea to the US, largely through in-app purchases inside free-to-play titles rather than upfront paid downloads.
- Subscription and IAP-heavy categories drive higher ARPU in Western markets. Streaming, fitness, productivity, and dating apps monetize through recurring subscriptions in the US, UK, Germany, and Canada, where payment infrastructure and willingness to pay recurring fees are both strong.
- Ad-driven monetization scales with install volume in lower-ARPU countries. In India, Brazil, Indonesia, and much of Southeast Asia, apps lean on advertising because per-user willingness to pay for subscriptions remains limited relative to Western markets, even as total user counts run enormous, making common Meta Ads mistakes particularly risky for UA strategies in these segments.
- Revenue concentration keeps rising at the top of the market. Practitioner analysis shows the top 10% of apps capture the overwhelming majority of subscription revenue, which means entering a large market rarely guarantees meaningful revenue unless the product can differentiate against entrenched leaders.
For strategy planners, this segment breakdown matters more than the country ranking alone. A market with modest total app revenue but a thin competitive field in your specific category can outperform a “top 10” country where five entrenched apps already capture most of the available subscription spend.
App Revenue Trends Through 2029: Where Growth Is Concentrating
Growth in 2025 and 2026 hasn’t spread evenly. Some regions are compounding fast off a small base, while the largest markets keep growing but at a steadier, more mature pace.
Growth signal: Sensor Tower’s Digital Market Index shows the US leading absolute consumer spend growth, with nearly $15 billion in quarterly in-app purchase spend in a recent reporting period, while Europe added significant year-over-year revenue and Brazil posted some of the fastest growth rates of any single country tracked.
That combination tells you something useful about where to look next. The US remains the anchor market by dollar volume, but the rate of growth is shifting toward Latin America and parts of Europe that were previously treated as secondary markets.
Statista’s forecast trajectory for the app market points toward continued expansion past $739.61 billion in 2026. Steady growth is expected through the 2025 to 2029 window as subscription models mature in more countries and ad-tech recovers from earlier privacy-driven disruptions. The pace of growth in mature markets like the US and Japan is expected to moderate compared to emerging markets, where install bases are still expanding quickly.
Revenue concentration adds a complicating layer. Even in fast-growing markets, a small number of top-grossing apps absorb most of the new spend, so raw country growth rates can overstate opportunity for a new entrant. Growth at the country level and growth at the category level need to be evaluated separately before any market-entry decision gets made.
Turning Country Revenue Data Into Market Decisions
Raw country rankings are a starting point, not a decision. The gap between “the US is the biggest market” and “we should launch in the US” is filled with unit economics that public reports rarely spell out at the level a pricing or growth team needs.
A workable KPI set for country-level evaluation includes:
- ARPU (average revenue per user) to gauge monetization efficiency independent of population size.
- Spend per downloader, which isolates how much of the install base actually converts to paying behavior.
- D30 conversion rate, tracking how many trial or free users are still paying 30 days in.
- LTV (lifetime value) by cohort, ideally segmented by acquisition channel and country.
- Retention curves, since high revenue per user paired with poor retention often signals an unsustainable spike rather than a durable market.
The decision framework analysts should apply weighs four factors against each other: total revenue size, growth trajectory, customer acquisition cost, and regulatory or operational complexity. A market can score well on three of the four and still be a poor fit if, say, payment regulation adds months to launch timelines.
The most reliable workflow combines public forecasts with your own funnel data. Use Statista or Sensor Tower figures to size the opportunity, then run a localized pricing experiment before committing marketing spend. Practitioner research from RevenueCat and Adapty found localized price testing delivered roughly a 62.3% lift in LTV in one analysis, a gap large enough that skipping localized testing amounts to leaving revenue on the table before a product even launches.
Pro Tip: Before running a country-level price test, pull the target market’s existing top-grossing subscription tiers first. Testing a price that’s wildly out of step with local norms tells you nothing useful about actual willingness to pay.
What Apppricer Adds to Public Market Reports
Public forecasts from Statista and Sensor Tower answer the “how big” question well. They rarely answer the “what price, exactly” question, which is where most pricing and growth teams get stuck.
A specialized platform aggregates actual app prices, subscription tiers, and download trends across multiple countries for iOS apps, giving analysts a way to see what competitors are actually charging in specific markets rather than inferring it from category averages. That distinction matters for pricing work: knowing that a country generates strong subscription revenue overall doesn’t tell you whether the winning price point in that market is $4.99 or $14.99 a month.
Typical use cases include building pricing benchmarks against direct competitors before a launch, screening potential markets by comparing subscription structures across countries, and pulling data programmatically through the API for teams that want country pricing feeds inside their own dashboards.
How Regulation and Local Economics Shape Country Revenue
Regulatory environment changes what a country’s revenue figures actually represent, sometimes more than population or income does. Data protection rules, app store commission structures, and payment regulations all put a ceiling or a floor on monetization in ways that don’t show up in a simple revenue ranking.
The European Union’s Digital Markets Act has pushed platform changes around alternative app distribution and payment processing that affect how revenue gets reported and split between platforms and developers in EU markets. China’s regulatory environment goes further, requiring games to pass approval before release and restricting playtime for minors, both of which directly cap how much revenue certain categories can generate regardless of demand.
Local economic conditions matter just as much as formal regulation. Currency instability, inflation, and average disposable income all set a practical ceiling on subscription pricing. A market with strong smartphone penetration but volatile local currency, common across parts of Latin America and Southeast Asia, often shows higher download volume than revenue would predict, because price sensitivity keeps conversion rates low even when engagement is high.
For analysts, the practical implication is to treat regulatory and economic context as a filter before treating revenue size as an opportunity signal. A large market with an unstable currency or a restrictive app category regulation might still rank high in total revenue while being a poor near-term target for a new entrant in that specific category.
Why App Spending Habits Differ So Much by Culture and Demographics
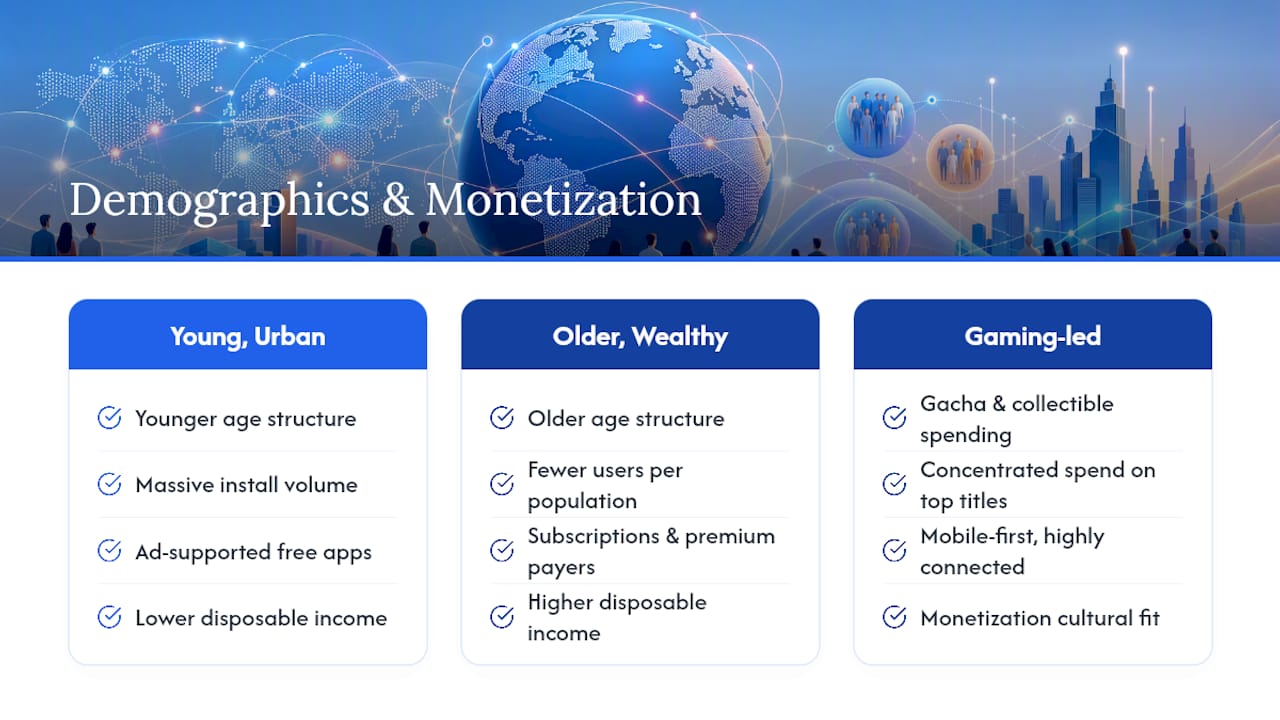
Demographics explain a surprising amount of the variance between countries with similar income levels but very different app revenue profiles. Age structure, urbanization, and cultural attitudes toward digital payment all shape which categories monetize well in a given country.
Japan’s mobile gaming dominance ties directly to cultural spending habits around gacha-style mechanics and collectible content, a pattern that doesn’t translate cleanly to Western gaming markets even when the underlying game mechanics are similar. South Korea shows a comparable pattern, with concentrated spend in a small number of top titles reflecting both gaming culture and a highly connected, mobile-first population.
Younger, more urban populations in markets like India and Indonesia drive massive install volume but skew toward ad-supported free apps, partly because disposable income per user remains lower and partly because digital payment adoption, while growing fast, still trails smartphone adoption. Older, wealthier populations in markets like Japan, Germany, and the US show the opposite pattern: fewer total users relative to population, but far higher willingness to pay for subscriptions and premium features.
Family structure and household spending habits also matter more than most country comparisons account for. In markets where subscription costs get shared across a household, per-account revenue can understate real household spend on an app category. Analysts comparing raw ARPU across countries without adjusting for these cultural and demographic factors risk drawing the wrong conclusion about market potential.
How Currency Swings Distort Reported App Revenue
Exchange rate movement changes reported revenue even when nothing about actual user behavior shifts. Most global market reports, including Statista’s forecasts, convert local currency revenue into US dollars for comparison, which means a country’s reported growth or decline can partly reflect currency movement rather than a genuine change in spending.
A market where local pricing stays flat in local currency but the local currency weakens against the dollar will show declining dollar-denominated revenue in global reports, even though nothing changed for local users or the developer’s local pricing strategy. The reverse happens too: currency strengthening can make flat local revenue look like growth in dollar terms.
This matters most for markets with historically volatile currencies, including several in Latin America and parts of Southeast Asia, where year-over-year dollar comparisons can swing significantly based on macroeconomic conditions unrelated to app usage. Analysts comparing country revenue trends over multiple years should check whether a reported change reflects local currency performance or dollar conversion effects, especially when a country’s currency has moved sharply against the dollar during the comparison period.
For app businesses setting international pricing, this also raises a practical question: whether to keep local prices fixed in local currency, which protects the user experience but exposes revenue to currency swings, or to periodically adjust local prices to track dollar-equivalent targets, which protects revenue but risks pricing disruption for existing subscribers.
ARPU by Country: The Real Measure of Monetization Efficiency
Total revenue tells you market size. ARPU tells you monetization efficiency, and the two rankings rarely match.
The gap between iOS and Android ARPU already shows up clearly in the platform data, with iOS users spending roughly double their Android counterparts on average. That same efficiency gap shows up between countries. The US, Japan, and other mature Western and East Asian markets consistently post higher ARPU than their total download volume alone would suggest, while high-population markets like India and Indonesia show the opposite: massive scale, comparatively low ARPU.
RevenueCat and Adapty’s practitioner data puts this gap in concrete terms, with median Year 1 revenue per paying user landing around $32 in North America compared to roughly $23 globally and closer to $14 in India and Southeast Asia. That’s more than a two-to-one spread between the strongest and weakest major regions, and it’s the single most useful number for deciding whether a market is worth a dedicated monetization strategy or better served by a simplified, ad-supported approach.
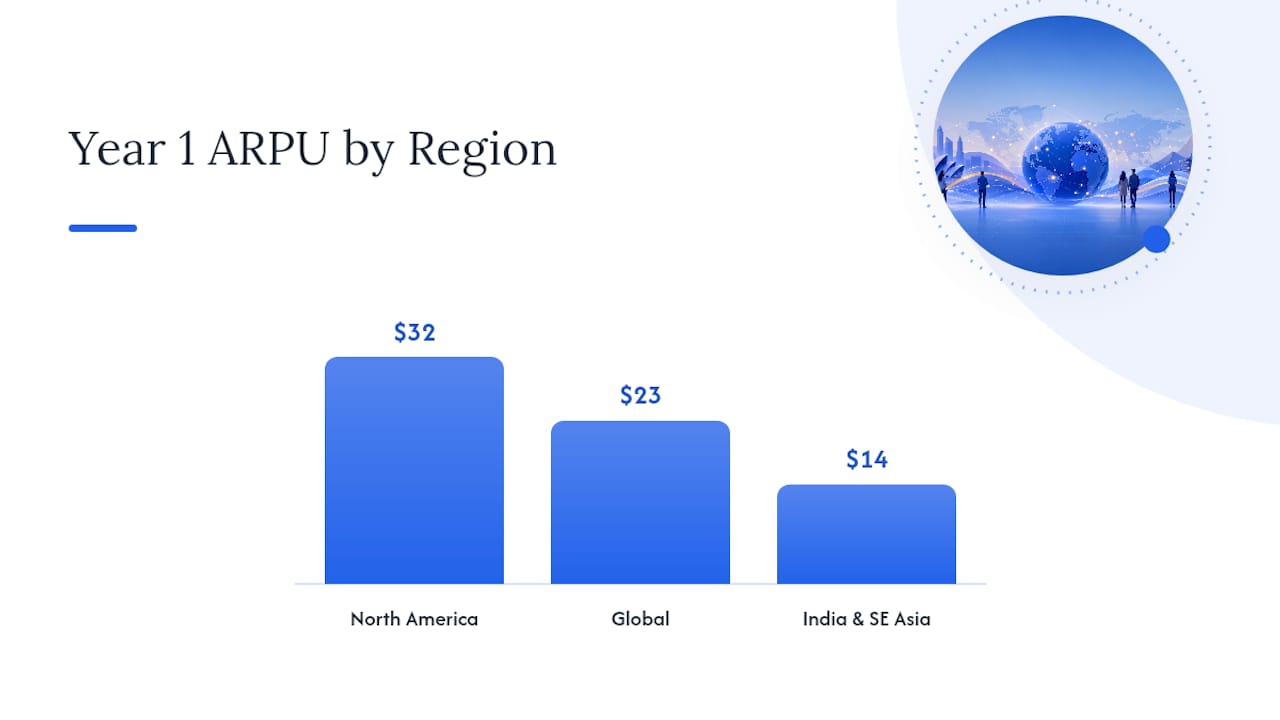
ARPU comparisons only work when you control for category, though. Comparing ARPU for a productivity app in Germany against a casual game in Brazil tells you nothing useful; the categories monetize on fundamentally different models. The more reliable approach is comparing ARPU for the same category across countries, then layering in retention and CAC before deciding where a specific product is likely to perform well.
How Payment Method Availability Shapes App Revenue
Payment infrastructure sets a hard ceiling on app monetization in some countries regardless of how much users actually want to spend. A country with high engagement but limited digital payment penetration will underperform its apparent potential until payment friction gets solved, either by the platform or by local payment partners.
Credit card penetration varies enormously by country, and in markets where it’s low, mobile wallets and carrier billing often fill the gap. India’s UPI system and various mobile money platforms across Africa have become essential payment rails for app monetization precisely because traditional card infrastructure never reached the same penetration as in the US or Western Europe. Apps that support only card payments in these markets leave significant revenue unclaimed simply because the preferred local payment method isn’t available at checkout.
China again stands apart, with Alipay and WeChat Pay handling the overwhelming majority of digital transactions, including in-app purchases distributed outside Google Play. An app entering the Chinese market without integrating these payment rails effectively locks out most of its addressable audience regardless of product quality.
For analysts building country revenue models, payment method availability deserves the same weight as pricing strategy. A well-priced subscription in a market with poor payment method coverage will underperform a slightly worse-priced subscription that matches local payment habits, which is a detail no aggregate revenue figure by itself will ever reveal.
The Real Lesson in Country Revenue Data
Most market analysis treats country revenue rankings as a proxy for opportunity, and that’s the mistake worth pushing back on. A country ranking third by total revenue can be a worse target than one ranking eighth, once you account for category-level competition, payment friction, and how much of that revenue concentrates in two or three incumbent apps.
The conventional advice, “go where the revenue is,” undersells how much variance sits inside a single country number. Japan’s app revenue is enormous, but almost entirely gaming. A subscription-based productivity app chasing that market off the strength of the country ranking alone would be reading the wrong number.
What the research actually supports is a sequence: use public forecasts to size the total opportunity, then check category concentration and payment infrastructure before assuming that size translates into your specific product’s potential. Localized pricing data closes the gap public forecasts leave open, and it’s worth treating as a prerequisite step rather than an optional refinement. The analysts who get burned aren’t the ones who read the wrong ranking. They’re the ones who stopped reading after the ranking.
— Sergey
Get Country-Level Pricing Data Without the Guesswork
Public forecasts tell you which countries generate the most app revenue. They don’t tell you what a competitor is actually charging in Brazil this month, or whether a subscription tier that works in Germany will hold up in South Korea. That gap is where pricing decisions stall.
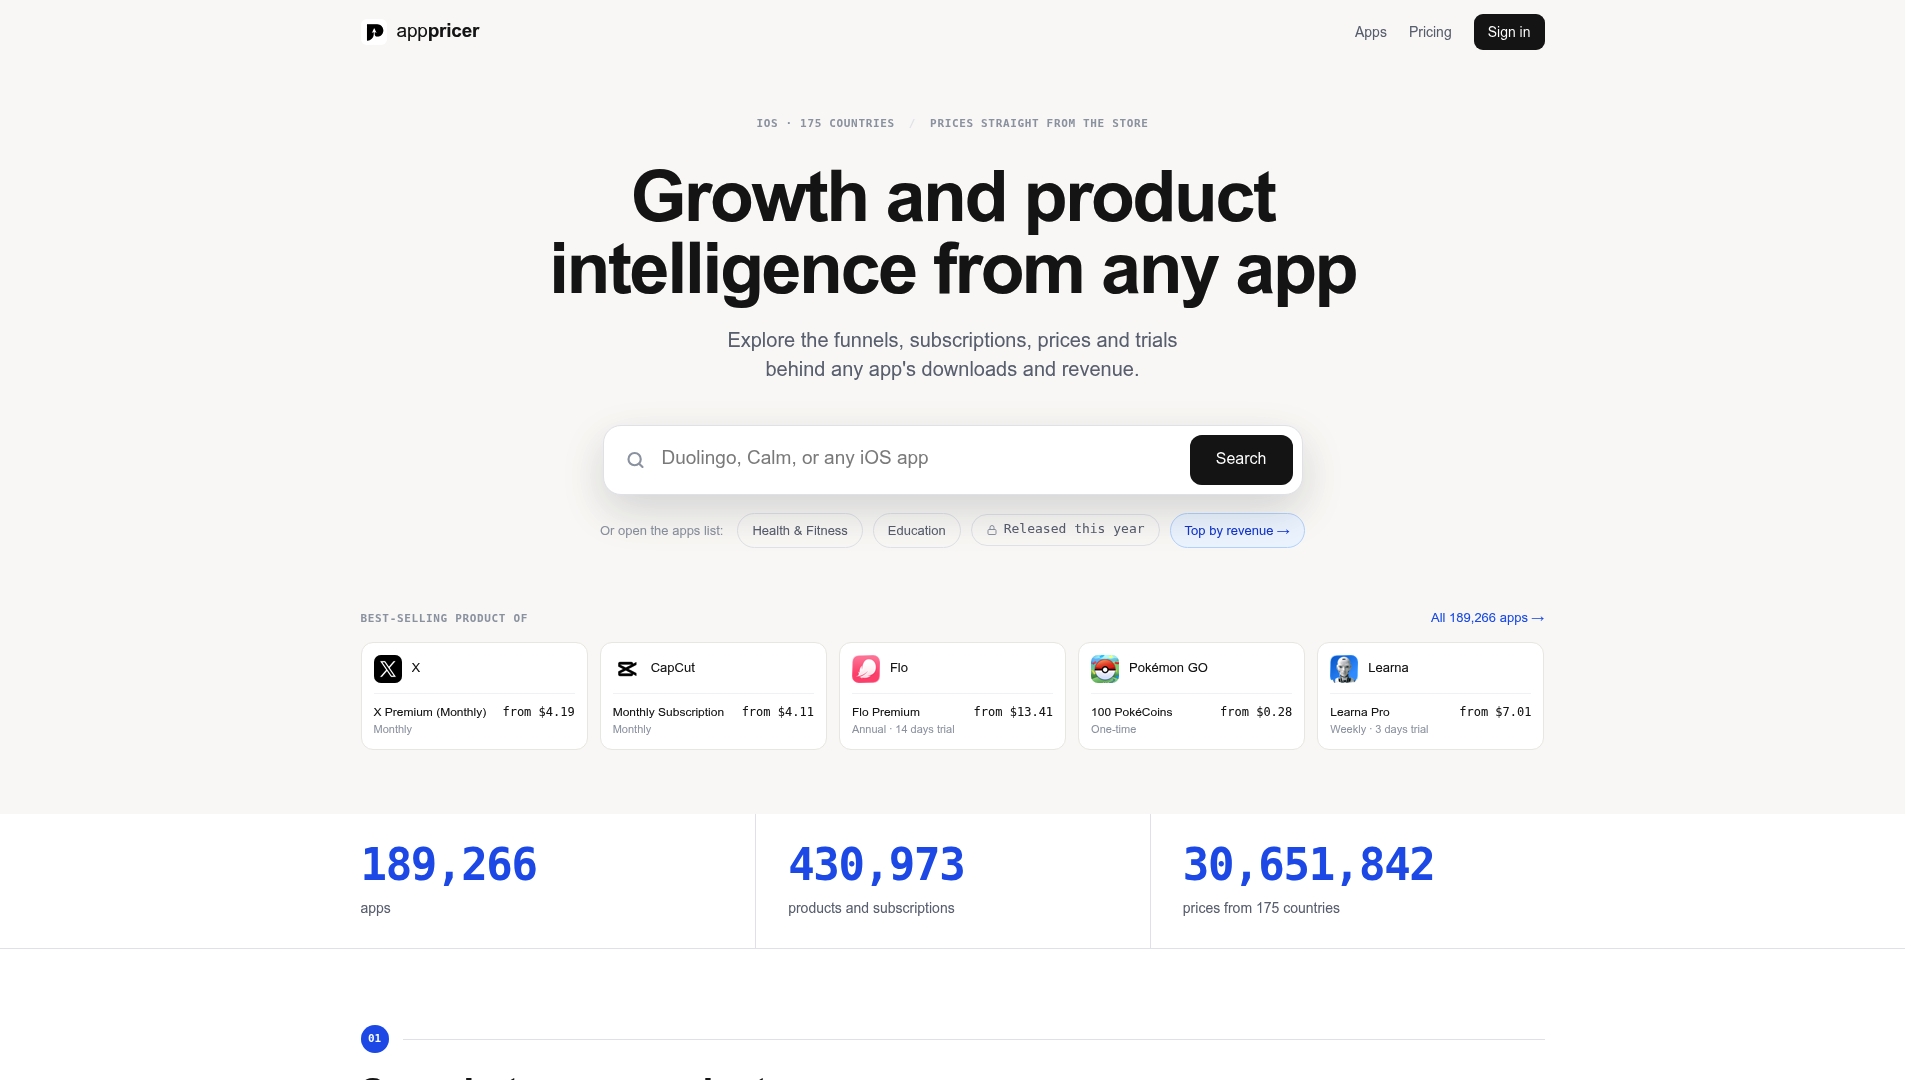
This gap is closed by aggregating real app prices, subscription tiers, and download trends across multiple countries for iOS apps, so users can benchmark against actual competitor pricing instead of category averages. Browse the live dataset of iOS app prices and subscription tiers to see how pricing structures shift from one market to the next, or explore the full platform and API access to pull country pricing data directly into your own dashboards. If a country revenue table raised more questions than it answered, that’s the next step to actually answer them.
Sources
- App - Worldwide | Statista Market Forecast
- App Data Report 2026: Revenue, Downloads and …
- Digital Market Index
- State of App Monetization 2026: Key Trends from RevenueCat and Adapty
FAQ
What Are the Top-Grossing Apps in the World?
Top-grossing apps skew heavily toward mobile games and a handful of entertainment and productivity platforms, with titles like TikTok and Google One appearing repeatedly across country-level leaderboards tracked by Business of Apps.
How Much Is an App With 100,000 Users Worth?
There’s no single figure because value depends entirely on monetization model, category, and country mix. An app relying on subscriptions with strong retention in a high-ARPU market like the US can be worth far more than an ad-supported app with the same user count in a lower-ARPU market.
What Is the Number One App in the World by Revenue?
The top-grossing app shifts by ranking period and category, but mobile games and subscription-based entertainment apps consistently occupy the top spots across most major markets, according to Business of Apps’ leaderboard data.
How Can I See How Much Revenue an App Is Making?
Public estimates come from firms like Statista, Sensor Tower, and Business of Apps, which model revenue from download volume, in-app purchase patterns, and store ranking data. For competitor-level pricing detail specifically, tools like Apppricer track actual price tiers and subscription structures across multiple countries.
Which Country Spends the Most on Apps?
The United States leads in total app spend, with Statista projecting $317.39 billion in US app revenue for 2026, well ahead of China and Japan in the second and third positions.