3 App Monetization Metrics Product Teams Must Track

Seven metrics separate apps that make money from apps that just have users: ARPU, LTV, paying conversion, retention at day 1/7/30, DAU/MAU, and eCPM/CTR for ad-supported products. Every one of them exists to answer a single question — does engagement actually turn into revenue, and does that revenue justify what you spent acquiring the user? The rest of this guide defines each metric, shows you the formula, and tells you which ones to prioritize depending on whether you run ads, subscriptions, or in-app purchases.
TL;DR:
- Only monitor high-impact metrics like retention, paying conversion rate, and LTV:CAC ratio before expanding to secondary indicators to ensure core viability.
- Report ARPU and LTV based on proceeds after platform commissions to reflect actual income and avoid inflated or misleading numbers.
- Use cohort analysis to accurately track lifetime value and prevent unreliable extrapolation of short-term data into long-term forecasts.
- Segment users by demographic, platform, or behavior to uncover hidden monetization patterns that average metrics mask.
- Benchmark ARPU against category and regional norms carefully, adjusting for monetization models, to identify meaningful areas for growth or improvement.
Table of Contents
- Core App Monetization Metrics: ARPU, ARPPU, and ARPDAU
- Calculating Lifetime Value and Pairing It With Acquisition Cost
- Conversion Metrics: Turning Installs Into Paying Users
- Engagement and Retention: The Foundation Monetization Depends On
- Ad Monetization Metrics: eCPM, Fill Rate, and CTR
- Subscription Metrics: MRR, Churn, and Revenue Retention
- Building Revenue Cohorts and Prioritizing Experiments
- Keeping Your Metrics Honest: Validation and Hygiene
- Prioritizing Metrics by Monetization Model
- Segmenting Users to Find Hidden Monetization Patterns
- Benchmarking ARPU Against Industry Standards
- Metrics for Hybrid and Emerging Monetization Models
- The Real Cost of Acquisition on Monetization Profitability
- What I’d Track First With Limited Bandwidth
- Benchmark Your Pricing With Apppricer
- Where These Metric Definitions Come From
- Sources
- FAQ
Core App Monetization Metrics: ARPU, ARPPU, and ARPDAU
Revenue metrics only mean something when you know exactly what’s in the numerator and denominator. Get sloppy here and every downstream decision, from pricing to ad placement, gets built on a bad number.
Average Revenue Per User (ARPU) is total revenue divided by active users over a set period, usually a month. If your app pulled in $50,000 last month from 25,000 active users, your ARPU is $2.00. It’s the broadest lens on monetization health, but it hides a lot — an app with 2% paying users and an app with 20% paying users can post the same ARPU with wildly different underlying economics.
That’s where ARPPU (Average Revenue Per Paying User) comes in. Divide revenue by paying users only, not your whole active base. ARPPU tells you how much your actual customers spend, separate from the noise of free riders. For ad-heavy apps, ARPDAU (Average Revenue Per Daily Active User) is the more useful daily pulse check, since it captures ad impressions and IAP together on a day-by-day basis rather than a monthly average that can smooth over real swings.
One distinction trips up more finance and product teams than any other: gross revenue versus proceeds. Gross revenue is what the customer paid. Proceeds are what you actually receive after Apple or Google take their commission and after refunds process — and those platform definitions of sales, proceeds, and paying users are the ones you should build your reporting around.
Three things commonly distort these numbers:
- Unvalidated or fraudulent transactions inflate gross revenue without ever generating real proceeds.
- Refunds processed weeks after purchase create phantom revenue that vanishes retroactively from your dashboards.
- Multi-currency reporting without a consistent conversion rate makes country-level ARPU comparisons meaningless.
Pro Tip: Always report ARPU and ARPPU on proceeds, not gross sales. Store commissions run 15% to 30% depending on the platform and your revenue tier, and reporting gross numbers to your team sets expectations that your actual bank deposit won’t match.
Calculating Lifetime Value and Pairing It With Acquisition Cost
Lifetime value tells you how much a user is worth over their entire relationship with your app, and it’s the number that should drive every acquisition budget decision you make.
The simplest formula is LTV = ARPU × average customer lifespan. If your ARPU is $2 per month and users stick around for an average of 10 months, your LTV is $20. It’s quick, but it leans on an average lifespan figure that’s often just a guess pulled from thin data.
A more reliable approach is cohorted LTV: sum the total revenue generated by a specific install cohort over a fixed window, then track how that number matures. Here’s how to build one properly:
- Pick an install cohort — everyone who installed in a given week or month.
- Choose a measurement window — 90, 180, or 365 days are the standard choices, with 90 days giving you faster feedback and 365 days giving you a fuller picture of subscription renewals and long-tail spenders.
- Sum revenue per user within that window, then track how the curve flattens over time to project forward without overreaching.
- Compare cohorts month over month to see whether product changes are actually moving the needle on lifetime value, not just short-term conversion.
Projecting lifetime revenue past your actual data window is where teams get into trouble. It’s tempting to extrapolate a 30-day LTV curve out to 12 months, but unless you’ve validated that the curve holds shape, you’re basically forecasting on hope.
Once you have a trustworthy LTV number, pair it against customer acquisition cost (CAC). The commonly cited healthy benchmark is an LTV:CAC ratio above 3:1, with payback period, how long it takes to recoup CAC, ideally under 12 months for mobile. Below that ratio, you’re often paying more to acquire users than they’ll ever be worth.
Conversion Metrics: Turning Installs Into Paying Users
Every dollar of revenue starts as a percentage somewhere in your funnel. The paying conversion rate, the share of active users who make at least one purchase, is the metric most directly tied to monetization health, but it’s really a chain of smaller conversion rates worth tracking individually.
Break the funnel into three measurable stages:
- Install to trial: the percentage of new installs who start a free trial or enter a paywall flow, calculated as trial starts divided by total installs.
- Trial to paid: the percentage of trial users who convert to a paying subscription, one of the single best predictors of subscription revenue health.
- Cart to purchase: for IAP and one-time purchases, the percentage of users who reach a purchase screen and actually complete the transaction.
Instrumenting this properly means firing events at every step, not just at the final purchase. Log paywall views, button taps, payment sheet opens, and completed transactions separately, then segment those events by acquisition channel, device type, and install cohort. A conversion rate that looks fine in aggregate often falls apart when you split it by channel. Users from a paid social campaign convert at half the rate of organic search traffic, for instance, which tells you something about traffic quality that ARPU alone never would.
Once you can see where users drop off, the optimization levers are fairly well established: shorten the paywall flow to reduce friction, make sure payment methods are pre-validated before the ask, and run pricing experiments rather than assuming one price point works globally. A/B testing different paywall designs, copy, and timing (showing the paywall after a value moment instead of on first launch) routinely moves conversion more than any single design tweak.
Engagement and Retention: The Foundation Monetization Depends On
You can’t monetize users who don’t come back, and that’s not a platitude, it’s the actual mechanical relationship this section is built on. Engagement and retention are foundational to monetization, and users who engage more convert and generate lifetime value at meaningfully higher rates than passive installs.
DAU/MAU ratio (daily active users divided by monthly active users) measures how “sticky” your app is. A ratio above 20% generally signals a habit-forming product; below 10% suggests users are trying your app once a month at best, which caps how much revenue any single user can generate regardless of pricing strategy.
The metric that predicts monetization outcomes better than almost anything else is retention by install cohort, measured at day 1, day 7, and day 30. Day-30 retention in particular is strongly predictive of long-term revenue, because users still active a month in have already survived the drop-off cliff that claims most installs.
| Retention checkpoint | What it signals |
|---|---|
| Day 1 | Onboarding quality and first-session value |
| Day 7 | Habit formation and early feature adoption |
| Day 30 | Long-term product-market fit and LTV ceiling |
Pro Tip: If day-30 retention is weak, fix that before you touch pricing. No paywall redesign compensates for an app that most users abandon within a week.
Ad Monetization Metrics: eCPM, Fill Rate, and CTR
Ad-supported apps run on a different set of numbers, and the math connecting them is worth memorizing. eCPM (effective cost per thousand impressions) is your ad revenue divided by impressions, multiplied by 1,000. Fill rate is the percentage of ad requests that actually return a served ad. CTR (click-through rate) is clicks divided by impressions, and it feeds directly into how ad networks price your inventory over time.
Put together: ad revenue = impressions × fill rate × eCPM ÷ 1,000. Move any one of those levers and ARPDAU shifts with it.
Format choice matters more than most teams realize:
- Rewarded video typically carries the highest eCPM and the least retention damage, since users opt in.
- Interstitials monetize well but placed poorly, they spike churn.
- Banners generate steady but modest revenue with minimal disruption.
If ad revenue per user is climbing while retention holds flat, keep optimizing placements and mediation waterfalls. If retention starts sliding, that’s your signal to test a reduced-ad or paid tier instead of squeezing more impressions out of the same users.
Subscription Metrics: MRR, Churn, and Revenue Retention
Subscription apps live or die on recurring revenue predictability, and that requires a distinct metric set from one-time purchase models. Subscription monetization requires tracking lifecycle events, not just point-in-time revenue snapshots.
The essentials:
- MRR/ARR (monthly/annual recurring revenue): predictable revenue from active subscribers, the backbone number for forecasting.
- Churn rate, split into active churn (users who cancel) and revenue churn (dollars lost, which weighs bigger accounts more heavily).
- Trial-to-paid conversion: the percentage of free trial users who convert to a paid plan, often the single highest-leverage number in a subscription business.
- Net revenue retention: expansion revenue minus churned revenue, showing whether your existing base is growing or shrinking in dollar terms.
Track lifecycle events, trial starts, renewals, cancellations, and downgrades, as discrete data points, then roll them into cohort revenue reports rather than a single blended MRR line. That’s the only way to see whether a pricing change from three months ago actually improved retention or just moved the churn further down the funnel.
Building Revenue Cohorts and Prioritizing Experiments
Cohort analysis turns a pile of transaction data into an answer about what’s actually working. Build revenue cohorts by grouping users by install date (not just purchase date), then track cumulative revenue per cohort across a fixed window, 30, 90, or 180 days depending on your sales cycle.
- Segment cohorts by acquisition source and country to isolate which channels produce genuinely high-value users versus ones that look good on install volume alone.
- Select a consistent measurement window across all cohorts so month-over-month comparisons aren’t distorted by different maturity levels.
- Score potential experiments using impact × confidence × effort, prioritizing pricing tests, localization, and paywall UX changes, which tend to score highest on impact for the lowest build cost.
- Run tests continuously, not as one-off projects.
That last point isn’t just process advice. Apps that run frequent, targeted experiments can generate up to 40 times more revenue than apps that rarely test, with pricing and localization experiments driving the largest lifetime value gains.
Keeping Your Metrics Honest: Validation and Hygiene
Bad instrumentation quietly poisons every metric in this article. Payment validation, server-side acknowledgment of purchases plus anti-fraud checks, is non-negotiable, because unvalidated transactions inflate ARPU and LTV with revenue that never actually settles.
A short checklist worth running quarterly:
- Track gross sales and net proceeds as separate line items, never one blended number.
- Apply consistent currency conversion rates across all country-level reporting.
- Account for payout time lag, since store payments often settle 30 to 60 days after the transaction date.
- Standardize event naming and deduplication across platforms so an “purchase_complete” event means the same thing on iOS and Android.
- Set a fixed reporting cadence (weekly for operational metrics, monthly for cohort LTV) so trends aren’t distorted by inconsistent time windows.
Get this hygiene wrong and every metric above becomes a guess dressed up as data.
Prioritizing Metrics by Monetization Model
You don’t need forty dashboards. UXCam’s KPI research recommends tracking a focused set of roughly ten metrics tailored to your specific model rather than monitoring everything at once, and that advice holds up under scrutiny. Here’s the practical starting list:
- Ad-supported apps: DAU/MAU, session length, eCPM, fill rate, CTR, ARPDAU, retention D1/D7/D30, and impressions per user.
- IAP/freemium apps: paying conversion rate, ARPU, ARPPU, LTV, retention D1/D7/D30, cart-to-purchase conversion, and CAC.
- Subscription apps: trial-to-paid conversion, MRR, churn (active and revenue), net revenue retention, LTV:CAC, and renewal rate.
Benchmarking these numbers against your category is where a tool like Apppricer earns its place, since aggregated pricing and subscription structures across 175 countries give you a real reference point instead of guessing whether your ARPU is competitive.
Pro Tip: Pick your top 10 metrics for your model, put them on one dashboard, and resist adding an eleventh until you’ve acted on what the first ten are telling you.
Segmenting Users to Find Hidden Monetization Patterns
Blended metrics flatten the differences that actually explain your revenue. Segment users by demographics (age band, country, platform) and behavior (session frequency, feature usage, referral source), and patterns emerge that a single ARPU number will never surface.
A user acquired through an influencer campaign in one country might have double the ARPPU of the same channel in another country, simply because purchasing power and local pricing norms differ. Behavioral segments matter just as much: users who engage with a core feature within their first three sessions often convert to paying at several times the rate of users who don’t, which tells you exactly where to focus onboarding effort.
Practical segmentation cuts worth running:
- By country or region, since currency, pricing sensitivity, and payment method availability vary enormously.
- By platform (iOS vs Android), which often shows different ARPU due to differing store fee structures and user willingness to pay.
- By acquisition channel, separating paid, organic, and referral traffic to see which actually produces high-LTV users versus high-volume, low-value installs.
- By behavioral cohort, grouping users by feature adoption speed or session frequency rather than just demographics alone.
The goal isn’t more dashboards. It’s finding the two or three segments responsible for a disproportionate share of revenue, then building acquisition and retention strategy around replicating them.
Benchmarking ARPU Against Industry Standards
Raw ARPU numbers mean very little in isolation. A $3 monthly ARPU might be strong for a casual game and weak for a productivity subscription app, so benchmarking against category and regional norms is what turns a number into a decision.
Category outlooks from sources like Statista’s app market data give you a directional sense of revenue and retention trends by app category and region, useful for sanity-checking whether your growth trajectory is in line with the broader market or lagging behind it.
Three things to control for before you compare your ARPU to anyone else’s:
- Category: games, subscription utilities, and marketplace apps have fundamentally different revenue models and shouldn’t be benchmarked against each other.
- Geography: ARPU in North America and Western Europe typically runs several multiples higher than in price-sensitive regions, so a blended global ARPU can mask strong regional performance.
- Monetization model: comparing a freemium IAP app’s ARPU to a subscription app’s ARPU without adjusting for structure produces a meaningless comparison.
The more useful exercise is tracking your own ARPU trend over time against your own historical cohorts, then using external benchmarks only to flag when something looks structurally off, not as a target to hit for its own sake.
Metrics for Hybrid and Emerging Monetization Models
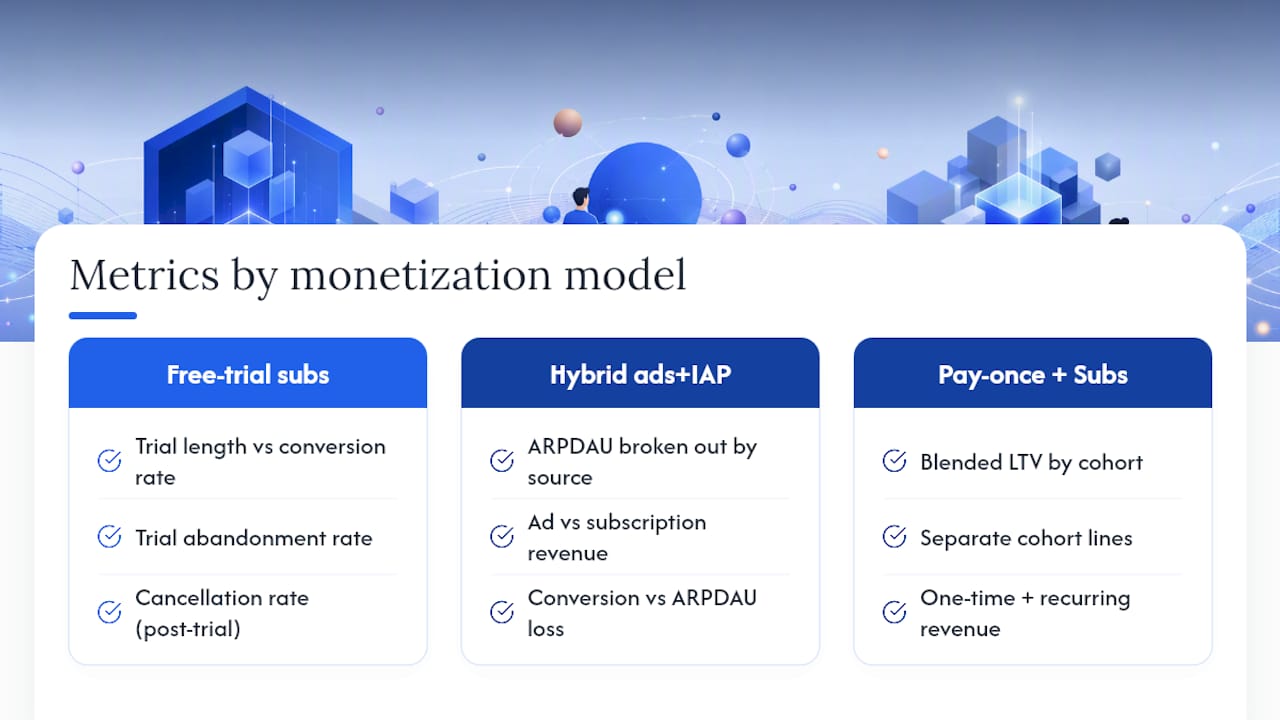
Free trials layered onto subscriptions, and hybrid ad-plus-IAP models, need their own metric combinations because a single KPI from either world tells an incomplete story.
For subscriptions with free trials, the critical addition is tracking trial length against conversion rate. A 7-day trial and a 14-day trial produce different trial-to-paid conversion numbers, and the right length depends on how long it takes a user to experience your core value. Watch trial abandonment rate separately from cancellation rate, since users who never activate during a trial are a different problem than users who activate, use the product, and still churn.
Hybrid models (ads plus optional subscription for an ad-free experience) require watching ARPDAU broken out by revenue source, ad revenue and subscription revenue tracked separately, so you can see whether a subscription push is cannibalizing ad impressions from users who would have converted anyway. The key tension metric here is conversion rate to ad-free tier relative to ARPDAU loss: if removing ads from converted users costs you more in lost ad revenue than the subscription generates, the tier needs repricing.
Newer variants like pay-once-unlock-forever combined with optional subscriptions for premium features need a blended LTV calculation that accounts for both the one-time purchase and any recurring add-on revenue, tracked as separate cohort lines rather than merged into a single average.
The Real Cost of Acquisition on Monetization Profitability
CAC isn’t a marketing metric that lives separately from monetization. It’s the other half of the equation that determines whether your revenue metrics actually represent a profitable business.
An app with strong ARPU and healthy retention can still lose money if acquisition costs climb faster than lifetime value. This is where the LTV:CAC ratio discussed earlier becomes a profitability gate rather than a vanity number: if CAC is rising across a channel while LTV holds flat, that channel is quietly eroding margin even as your top-line revenue chart keeps climbing.
Payback period matters as much as the ratio itself. An app with an LTV:CAC of 4:1 but a 24-month payback period carries far more cash flow risk than one with a 3:1 ratio and a 6-month payback, because the first business needs sustained capital to bridge the gap between spend and return. Tracking payback period by channel and by cohort lets you catch acquisition costs creeping upward before they erase your margin. Partner tools focused on campaign data analysis can help isolate which channels are quietly becoming unprofitable even while volume looks healthy.
The practical move is running CAC and LTV side by side in the same weekly report, broken out by channel, rather than reviewing acquisition spend and revenue performance in separate meetings weeks apart.
What I’d Track First With Limited Bandwidth
If your team only has room for a handful of metrics, start with retention (D1/D7/D30), paying conversion rate, and LTV:CAC. Everything else, eCPM, MRR, ARPPU, is a refinement layer that only matters once those three are healthy. Run small experiments constantly rather than one big pricing overhaul twice a year, and make sure product, growth, and finance are looking at the same cohort numbers instead of three different dashboards telling three different stories.
— Sergey
Benchmark Your Pricing With Apppricer
Most teams guess at pricing because there’s no easy way to see what actually works for comparable apps. Apppricer removes that guesswork by aggregating real app prices, subscription structures, and revenue trends across 175 countries, so you can see what pricing and trial structures your competitors actually run instead of reverse-engineering it from App Store screenshots.
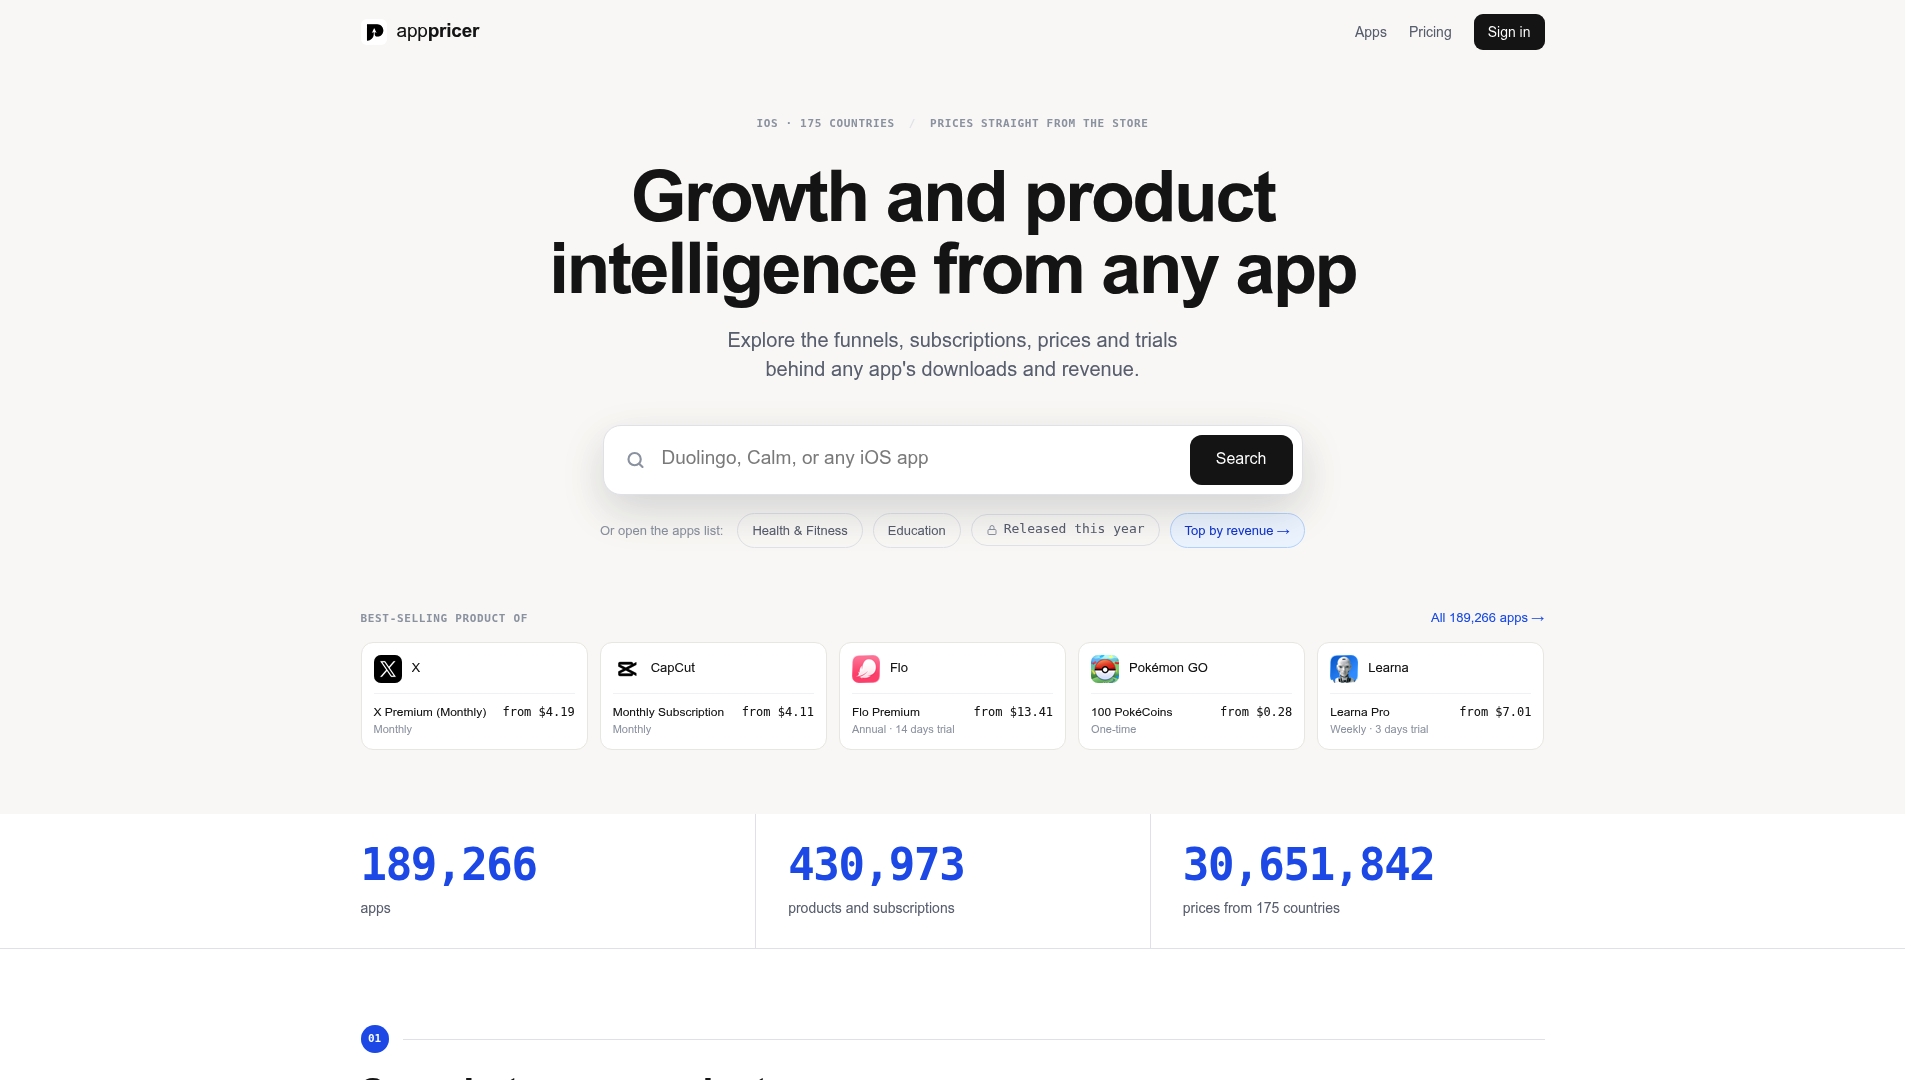
If you’re setting up an LTV:CAC benchmark or designing a new paywall test, start by checking how similar apps structure their pricing and subscription tiers across markets. Pull country-level revenue breakdowns before you localize pricing, not after you’ve already launched it. Visit Apppricer to see pricing and revenue data for apps in your category and start building experiments backed by market data instead of assumptions.
Where These Metric Definitions Come From
- Apple’s App Store Connect documentation for canonical definitions of sales, proceeds, and subscription events.
- UXCam’s KPI research for the ~10-metric prioritization framework by model.
- Pushwoosh for the engagement-to-retention-to-monetization pipeline.
- Statista for category and regional benchmarking context.
- Google Play’s strategic guidance for buyer-focused metric hierarchies.
FAQ
How much is an app with 100,000 users worth?
Valuation depends far more on ARPU, retention, and revenue trajectory than raw user count. Two apps with the same user count can differ in value by 10x or more depending on paying conversion rate and monthly recurring revenue.
Does Apple take 30% of in-app purchases?
Apple’s standard commission is up to 30%, dropping to 15% for developers in the Small Business Program earning under $1 million annually, and for subscriptions past their first year.
What are the key success metrics for an app?
The core set is ARPU, LTV, paying conversion rate, retention at day 1/7/30, and DAU/MAU, with eCPM and CTR added for ad-supported apps. Tracking roughly ten model-specific metrics, rather than dozens, tends to produce clearer decisions.
How much do top apps make per day?
Daily revenue for top-grossing apps varies enormously by category and model, and no single figure applies across subscription, IAP, and ad-supported apps. ARPDAU broken out by cohort and country is a more reliable way to benchmark your own app than any published top-apps figure.
How do I know which metrics to prioritize first?
Start with retention (D1/D7/D30), paying conversion rate, and LTV:CAC ratio, since these three reveal whether your product and acquisition economics are fundamentally sound before you optimize anything else.