25% Day 1: Peer Cohorts for App Download Benchmarks for Growth Teams

Most apps chasing download volume are optimizing the wrong number. If your Day-1 retention sits below 25%, fix onboarding and stability before you spend another dollar on paid acquisition. Global download totals are very large annually, per Statista, but the benchmark that actually predicts revenue is retention and conversion, not raw install count. Early-stage teams should anchor on product and retention; growth-stage teams should anchor on channel mix and acquisition efficiency, using peer data from App Store Connect and Statista as your reference points.
TL;DR:
- Focus on improving onboarding and stability if your Day-1 retention is below 25 percent, rather than increasing download volume.
- Benchmark retention and conversion metrics against peer groups with similar category, geography, and scale, not against broad industry averages.
- Be mindful of seasonal, event-driven, and campaign timing effects to avoid misinterpreting short-term fluctuations as long-term trends.
- Compare your channel mix with peer data for your specific category and size to accurately assess whether your organic or paid spend is appropriate.
- Use competitor pricing data combined with download trends to identify underpriced markets and guide effective pricing strategies.
Table of Contents
- App Download Benchmarks at a Glance
- What Each Core Metric Actually Measures
- Organic vs Paid: What Changes at Scale
- How to Build a Repeatable Benchmark Process
- Turning Country-Level Data Into Pricing Decisions
- Benchmarks for User Acquisition Cost Relative to Downloads
- Reading Benchmarks Around Update Cycles and Campaigns
- Seasonal and Event-Driven Swings in Download Volume
- Sergey’s Perspective: When to Stop Chasing More Downloads
- How Apppricer Turns Benchmark Gaps Into Pricing Decisions
- Sources
App Download Benchmarks at a Glance
Download totals vary wildly by source because providers count differently. Some measure unique new-user installs; others fold in re-downloads and third-party store activity. This is why one report might show double the volume of another. Statista’s long-run tracking is a solid anchor for year-over-year direction, even when absolute numbers shift depending on the methodology behind them.
Store conversion rate, in App Store terms, measures the share of product page viewers who complete a download. It is the single most controllable metric on this list, because screenshots, preview video, and the first line of your description move it directly.
Quick benchmark snapshot:
- Store conversion rate: commonly ranges from low to moderate percentages depending on category and creative quality
- Day-1 retention: apps below 25% usually have an onboarding or stability problem, not an acquisition problem
- Day-7 retention: typically a fraction of Day-1, and the drop-off rate matters more than the raw number
- Crash rate: even small increases correlate with measurable retention loss, according to Dynatrace
Pro Tip: Before you compare your numbers to any published benchmark, confirm whether that benchmark counts unique installs or total downloads. Comparing the wrong pair makes a healthy app look broken.
What Each Core Metric Actually Measures
Benchmarking only works when everyone agrees on definitions. A “unique install” counts one download per device or account; a “total download” counts every install event, including reinstalls after a user deletes and redownloads your app. Mixing the two inflates or deflates your numbers depending on which direction you’re comparing.
Store conversion rate is product-page views divided by downloads, as tracked in App Store Connect’s peer benchmarks. Day-1 retention is the percentage of new users who return the day after install; Day-7 retention repeats that measurement a week out. Crash rate is the share of sessions ending in a crash, and DAU/MAU (daily active users over monthly active users) captures stickiness, not just acquisition.
Sourced ranges worth knowing:
- Conversion rate benchmarks differ sharply by category, so compare against App Store Connect’s peer group, not the whole store average
- Retention benchmarks vary by vertical: social and gaming apps often see steeper early drop-off than utility apps, simply because the use case is more discretionary
- Crash rate has a direct, well-documented link to retention loss, per Dynatrace’s performance research
- DAU/MAU ratios tell you whether your retained users are actually engaged, or just haven’t uninstalled yet
Statistic Callout: Technical performance metrics like load time, crash rate, and jank are strongly tied to retention and conversion outcomes, not just to engineering quality scores. Treat crash rate as a growth metric, not just a bug tracker entry.
The immediate diagnostic step for each metric is different. A weak conversion rate points you to creative and messaging. Weak Day-1 retention points you to onboarding flow. A rising crash rate points you straight to your release pipeline, before you touch marketing spend at all.
Organic vs Paid: What Changes at Scale
Aggregate industry numbers and per-app reality often disagree, sometimes sharply. Linkrunner’s 2026 benchmark report found network-level installs split roughly 56.3% organic and 43.7% paid across the apps it tracked, a trend echoed by recent ChatGPT usage statistics showing shifts in user engagement and acquisition patterns. A handful of paid-heavy apps skew the aggregate; most apps lean far more organic than the network-wide number suggests.
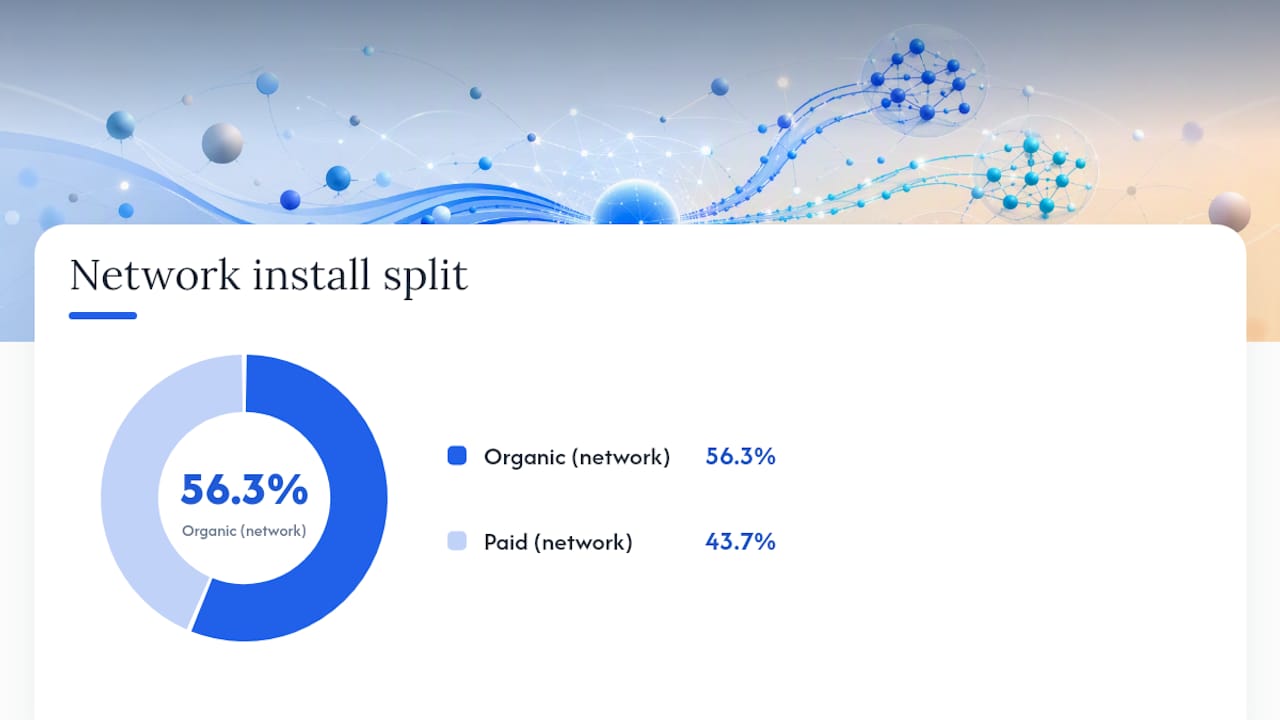
That gap matters because comparing your app to the aggregate figure can make a perfectly healthy organic-led app look like it’s under-investing in paid, when it’s actually performing right at the median.
How channel mix shifts by vertical and scale:
- Social and utility apps tend to skew organic, often driven by word-of-mouth and app-store search
- Fintech and e-commerce apps typically lean more on paid channels early, since trust and intent are harder to earn through discovery alone
- Micro and small apps (under a few thousand monthly installs) usually run organic-heavy, out of budget necessity as much as strategy
- Mid-size and large apps tend to blend both, shifting toward paid as they exhaust organic ceiling in their category
Pro Tip: Don’t benchmark your channel mix against the network aggregate. Pull the median per-app figure for your category and scale tier instead. It’s a more honest comparison, and it’s usually more forgiving.
How to Build a Repeatable Benchmark Process
Benchmarking only becomes useful once it’s repeatable, not a one-time snapshot you pull before a board meeting.
- Pick a real peer cohort. Match on platform, category, geography, and rough scale. Comparing a five-person indie puzzle game to a top-20 grossing title tells you nothing useful.
- Normalize your definitions before you compare anything. Confirm whether your peer data counts unique installs or total downloads, and match your attribution window (24-hour vs 7-day) to whatever the source uses.
- Pull from multiple sources and reconcile the gaps. Use your store console for first-party truth, an SDK for behavioral depth, and a market dataset for competitive context. When two sources disagree by more than a small margin, check the counting rules first, not your instrumentation.
- Separate lab metrics from field metrics. Android’s own performance measurement guidance recommends tools like Macrobenchmark and Perfetto for controlled, repeatable startup and jank testing, distinct from noisier real-world field data.
- Rank the gaps by effort versus impact. A broken onboarding screen is a low-effort, high-impact fix. Rebuilding your entire attribution stack is a long-term investment. Do the first kind before you commit to the second.
Pro Tip: Run the same benchmark pull on the same day of the week, every time. Weekday and weekend traffic patterns alone can distort a comparison enough to send you chasing a problem that doesn’t exist.
Turning Country-Level Data Into Pricing Decisions
Here’s a concrete example of the kind of gap raw download benchmarks don’t fill: two apps in the same category can have nearly identical download volume and wildly different revenue, simply because one is priced correctly for its top markets and the other isn’t. A country-level download trend paired with a competitor’s actual price and subscription snapshot can flag which markets carry higher average revenue per user, before you spend a quarter finding that out through your own pricing experiments.
That’s the specific gap Apppricer is built to close. Its outputs include:
- Aggregated app pricing and subscription-model data across 175 countries
- Revenue projections tied to specific apps and product tiers
- Country-level download trend tracking alongside competitor price snapshots
- API access for teams that want to pull this data programmatically into their own dashboards
Statistic Callout: Download volume alone can’t tell you which markets are underpriced. Pairing download trends with actual competitor pricing data, the way Apppricer’s app pricing tool does, is what turns a benchmark into a market-entry decision.
Benchmarks for User Acquisition Cost Relative to Downloads
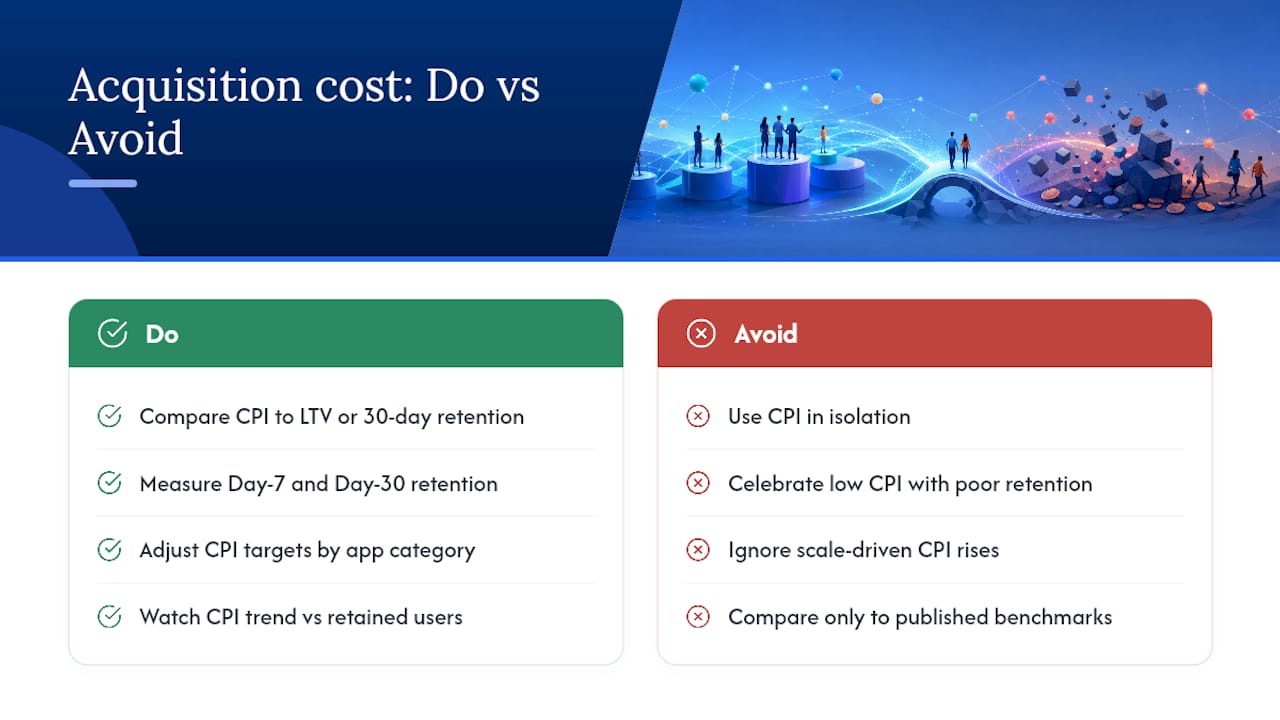
Cost per install (CPI) benchmarks are almost meaningless without a matching retention number attached. An app paying a low CPI but losing 80% of installs by Day-7 is burning budget faster than one paying a higher CPI with strong Day-7 retention, because the second app’s users are actually worth acquiring.
The more useful benchmark isn’t CPI in isolation. It’s the ratio of acquisition cost to lifetime value, or at minimum, acquisition cost against a 30-day retained-user count instead of raw installs. A download that churns in 48 hours cost you money and taught you nothing you can act on.
Acquisition cost benchmarks also shift heavily by category. Fintech and subscription apps generally tolerate a higher CPI because the lifetime value per converted user is higher. Free utility and casual gaming apps usually need a far lower CPI to stay profitable, since monetization per user tends to be thinner.
Scale changes the picture too. Smaller apps often see a lower blended CPI simply because they’re running narrower, more targeted campaigns. Once an app scales paid spend into broader audiences, CPI typically rises as the easiest, most responsive users get exhausted first. If your CPI is climbing month over month without a matching rise in retained users, that’s a channel-saturation signal, not necessarily a creative problem.
Compare acquisition cost against your own retention curve before you compare it to any published industry figure. The published number tells you what the market is paying. Your retention curve tells you what you can actually afford to pay.
Reading Benchmarks Around Update Cycles and Campaigns
A benchmark pulled the week after a major app update or marketing push will lie to you if you don’t account for the timing. Update cycles cause temporary spikes in both downloads and crash rate, since new code always carries some regression risk, and marketing campaigns inflate download volume in ways that don’t reflect your steady-state acquisition efficiency.
The fix is to separate your benchmark windows. Pull a “steady state” baseline from a period with no major release or campaign activity, then compare campaign-period numbers against that baseline instead of against a generic industry figure. A crash rate spike immediately following a release is expected. The same spike three weeks later, with no release in between, is a real problem.
Retention numbers need the same treatment. A big paid push often drags your average retention rate down temporarily, simply because paid users tend to be less qualified than organic users who sought your app out deliberately. That’s not necessarily your product failing. It’s a mix-shift artifact, and it corrects once the campaign cohort ages out of your averages.
Pro Tip: Tag every cohort with its acquisition source and campaign date before you run any retention analysis. Without that tag, a bad campaign and a bad product update look identical in your dashboard, and you’ll fix the wrong one.
Seasonal and Event-Driven Swings in Download Volume
Download volume isn’t flat across the calendar, and treating every month the same when you benchmark will produce false alarms. Shopping apps spike around major retail holidays. Fitness and productivity apps see a reliable bump every January. Travel apps swing with school breaks and long weekends, and social apps often see engagement dips during summer months in markets where outdoor activity competes for attention.
Category-specific events matter just as much as calendar seasonality. A game featured in a platform’s editorial spotlight can see downloads jump several times over baseline for a short window, then settle back down once the feature rotates off. That spike is real, but it’s not a new baseline, and benchmarking your “normal” performance against a spotlight week will set expectations you can’t sustain.
The practical move is to benchmark against the same period a year prior, not just against last month. Month-over-month comparisons during a seasonal swing tell you almost nothing useful. Year-over-year comparisons, adjusted for any major feature placement or campaign, give you a cleaner read on whether your underlying growth trend is actually improving.
Sergey’s Perspective: When to Stop Chasing More Downloads
Install volume is the easiest number to celebrate and the least reliable one to act on. Retention and revenue quality tell you whether those downloads mean anything. The three mistakes I see most: benchmarking against aggregate industry totals instead of a real peer cohort, comparing metrics pulled with different counting rules, and treating a seasonal spike as a new baseline.
If you find a genuine gap, the next step isn’t more spend. It’s diagnosis. Figure out whether the gap is retention, pricing, or acquisition efficiency, then fix that one thing before touching the others.
— Sergey
How Apppricer Turns Benchmark Gaps Into Pricing Decisions
Some platforms offer competitor pricing data alongside download and revenue trends across multiple countries.
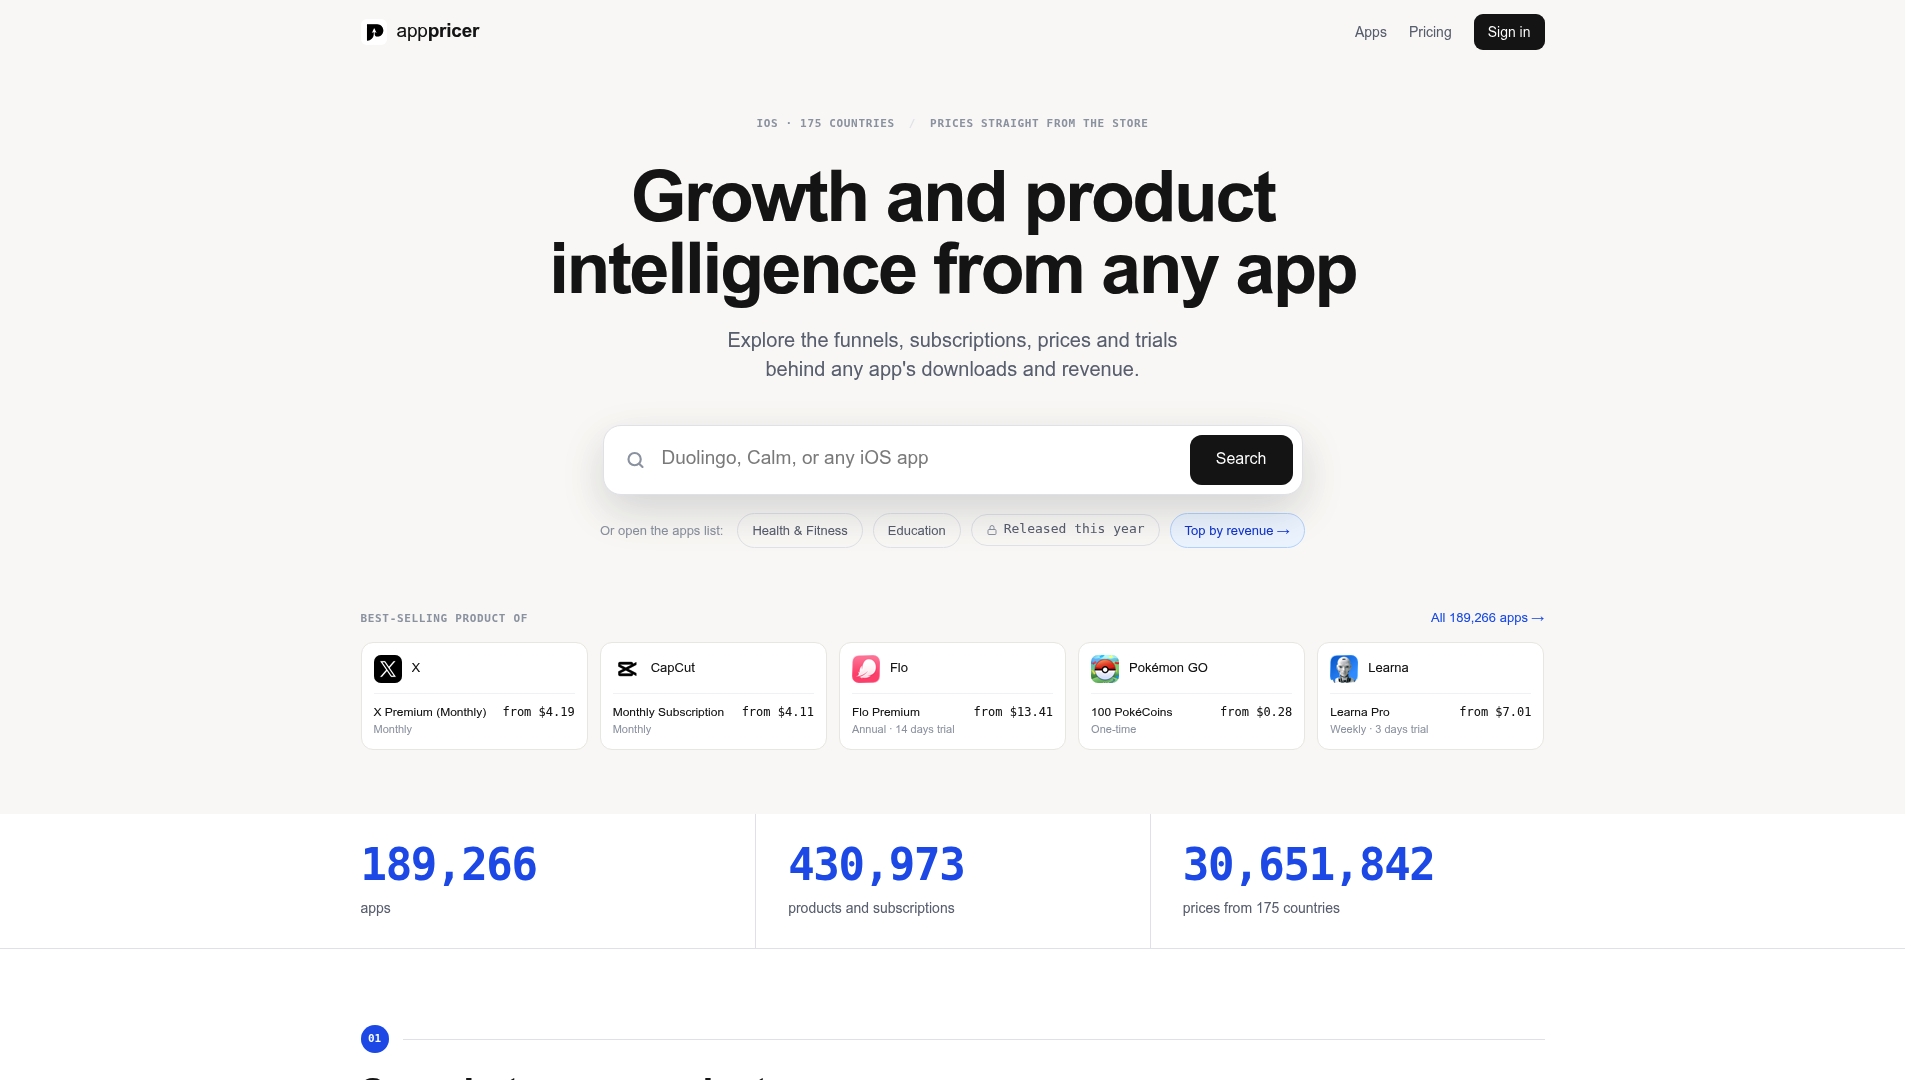
Available data can include country-level pricing and subscription snapshots, and revenue projections indicating which markets may be worth prioritizing. This data helps avoid guessing about competitive pricing by revealing subscription tiers and price points used by apps in your niche.
If you’ve read this far because a benchmark gap turned up in your own numbers, the fastest way to act on it is to check what comparable apps are pricing and earning right now. Browse pricing and subscription data for apps in your category or start with the full platform overview to see how the data connects to your growth plan.
Sources
- Benchmarks - App Store Connect Analytics - Help
- Number of mobile app downloads worldwide from 2018 to 2025 (Statista)
- Mobile app performance best practices and metrics (Dynatrace)
- Measuring performance (Android developer docs)