Developers & Growth Teams: 2026–26 Benchmarks for App Category Revenue

Games capture roughly half of all consumer app spending, with entertainment and productivity trailing far behind at single-digit shares. If you build games, ads and in-app purchases will carry you. If you build productivity or health tools, subscriptions do the heavy lifting, with far higher ARPU per user than games ever see. Pick your monetization model based on which side of that split your category falls on, not on what sounds trendy.
TL;DR:
- The most profitable categories are games, which generate the largest total revenue, but subscription-focused apps like productivity and dating achieve higher ARPU.
- Monetization strategies vary greatly by category, with games relying on in-app purchases and ads, while subscription apps dominate productivity and health sectors.
- Benchmarking your app’s ARPU and conversion rates against category leaders and using regional pricing insights can significantly improve revenue potential.
- Revenue data shows that top apps concentrate most income within a small percentage of high-spending users, emphasizing the importance of retention and targeted monetization.
- Platform fees and regional market differences cut into gross revenue, so realistic net revenue estimates and tailored pricing are crucial for setting achievable targets.
Table of Contents
- What Are the Top App Categories by Revenue?
- Which Monetization Model Fits Your App Category?
- What Are Realistic ARPU and Conversion Benchmarks?
- How Do You Estimate Revenue From Category Benchmarks?
- Why These Benchmarks Hold Up
- Does Your Region Change What a Category Earns?
- How Did COVID-19 and Other Shocks Reshape Category Revenue?
- How Do You Optimize Revenue Inside a High-Earning Category?
- What Are the Biggest Risks in Monetizing Certain Categories?
- Priorities Worth Setting Before You Build Next Quarter’s Targets
- Put These Category Benchmarks to Work With Apppricer
- Sources
- FAQ
What Are the Top App Categories by Revenue?
Total consumer spending across the App Store and Google Play hit $150.5 billion in 2025, spread across 110.5 billion downloads. That number alone tells you how concentrated this market is: a handful of categories account for almost everything.
Everything else, including photo and video, social, lifestyle, health and fitness, dating, and education, splits the remainder.
Broader industry counts back this up. Business of Apps puts combined app and game revenue at $166.8 billion for 2025, with subscription revenue climbing to about $79.5 billion and iOS capturing close to 70% of consumer spending worldwide. Statista’s category tables corroborate the same rank order.
A few things stand out when you break this down by category share:
- Games dominate by absolute dollars, not by revenue quality. Most of that $73.5 billion comes from a small number of top-grossing titles running in-app purchases and rewarded ads.
- Entertainment leans on subscriptions and transactional spend, which explains why its per-user value often beats games despite the smaller total pool.
- Productivity is small in total dollars but punches above its weight in ARPU, since it’s almost entirely subscription-funded.
- Photo and video, social, and lifestyle apps blend ad revenue with premium tiers, making their numbers harder to benchmark cleanly.
The category you pick determines the ceiling on your monetization model before you write a line of code.
Which Monetization Model Fits Your App Category?
Category dynamics dictate which revenue model actually works. Forcing a subscription onto a casual game, or forcing ads onto a productivity tool, tends to underperform against what the category’s own users expect to pay for.
- Games: in-app purchases plus rewarded video ads. Free-to-play dominates, and revenue concentrates in a small percentage of “whale” spenders alongside a broad ad-supported base.
- Entertainment: subscriptions and transactional purchases (rentals, one-time unlocks). Recurring billing works because content libraries reward ongoing access.
- Productivity: subscriptions, almost exclusively. Users expect to pay monthly or annually for tools that save them time, and RevenueCat’s 2026 dataset, tracking 115,000 subscription apps and $16 billion in revenue, shows this category converts more reliably than most others when trials run long enough.
- Marketplace and services apps: commission on transactions. Revenue scales with gross merchandise volume, not user count alone.
- Health, fitness, and dating: hybrid subscription models, often with a freemium tier gating premium features. Strava is a useful reference point here, approaching $500 million in annual recurring revenue largely on the strength of its subscription tier.
Subscription-heavy categories consistently show higher ARPU than ad- or IAP-driven ones, but they also demand patience: RevenueCat’s data shows freemium apps convert at a median of just 2.1% by day 35, versus 10.7% for apps using a hard paywall upfront. Hybrid models, blending ads, subscriptions, and IAP, can work, but monetization specialists at Tenjin caution against layering a second revenue stream before your primary one proves it converts and retains on its own.
What Are Realistic ARPU and Conversion Benchmarks?
Numbers without context mislead more than they help, so treat these as ranges to calibrate against, not targets to hit exactly.
- ARPU varies enormously by category. Subscription-first apps (productivity, fitness, dating) tend to sit well above ad-supported casual games on a per-user basis, even though games generate more total revenue.
- Free-to-paid conversion: RevenueCat’s day-35 median across freemium apps is 2.1%. Apps that gate access with a hard paywall from the start convert at 10.7%, more than five times higher, though at the cost of a smaller top-of-funnel audience.
- Trial-to-paid conversion: trial length matters more than most teams assume. Longer trial windows correlate with materially better conversion, because users need enough time to form a habit before the billing decision hits.
- Ad eCPM: rewarded video consistently outperforms banner ads, often by a wide margin, which is why top-grossing games lean on rewarded formats rather than static banners for the bulk of ad revenue.
Pro Tip: Don’t benchmark your ARPU against the category average alone. Compare against the top quartile in your specific subcategory, since revenue concentrates so heavily among leaders that the “average” app is a misleading target.
Platform commissions also eat into whatever gross revenue you project. Apple’s standard commission is 30%, dropping to 15% for developers enrolled in the App Store Small Business Program (generally those earning under $1 million annually). Google Play mirrors this structure closely. Build net revenue, not gross, into every target you set.
How Do You Estimate Revenue From Category Benchmarks?
Two formulas cover almost every monetization model:
Subscription revenue = paying users × subscription price × retention rate over the period measured.
Ad revenue = daily active users × sessions per day × ad impressions per session × fill rate × eCPM ÷ 1,000.
- Worked example A, subscription productivity app: 5,000 monthly active users, 2% free-to-paid conversion, $8 monthly subscription price. That’s 100 paying users generating $800 in monthly recurring revenue before platform fees. At Apple’s 15% Small Business rate, net revenue lands closer to $680 a month.
- Worked example B, ad-supported casual game: 50,000 daily active users, 3 sessions per day, 2 rewarded ad impressions per session, 80% fill rate, and a blended eCPM in the mid-range for rewarded formats. That funnel alone can produce a monthly ad revenue figure well into five figures, before any IAP layered on top.
- Sensitivity check: always model best, median, and worst case using a 1.5x swing on your conversion and eCPM assumptions. Category benchmarks give you a starting range, not a guarantee.
Run the math with conservative assumptions first. It’s far easier to raise a target after real data comes in than to explain a missed forecast to a stakeholder who anchored on your best case.
Why These Benchmarks Hold Up
The category figures throughout this piece pull from Sources with genuinely different vantage points, which is exactly why they agree. AppTweak’s category market intelligence tracks store-level revenue by category. Statista’s category snapshots cross-check those totals independently. Business of Apps supplies the industry-wide totals that frame both. RevenueCat’s dataset, Emergent, grounds the subscription conversion numbers in actual billing data from 115,000 apps.
Apppricer adds a layer these aggregate sources can’t: pricing and subscription structures at the individual app level, across 175 countries, aggregated directly from live store listings rather than survey samples. That granularity matters because category averages hide massive within-category variance. Two productivity apps in the same subcategory can price a subscription $3 apart and see wildly different conversion as a result.
Use public benchmarks like the ones above to set your first-year targets. Once you have live users, run your own sampling against direct competitors instead of relying on category averages that blend outliers with median performers.
- Category totals: AppTweak, Statista, Business of Apps
- Subscription and trial conversion: RevenueCat via emergent.sh
- Individual app pricing and competitor snapshots: Apppricer
Does Your Region Change What a Category Earns?
Category rankings hold roughly steady across markets, but the dollar amounts inside each category swing hard by region and demographic. A dating app in a market with high disposable income and strong subscription culture can post ARPU multiples above the same app in a price-sensitive market, even with similar download volume.
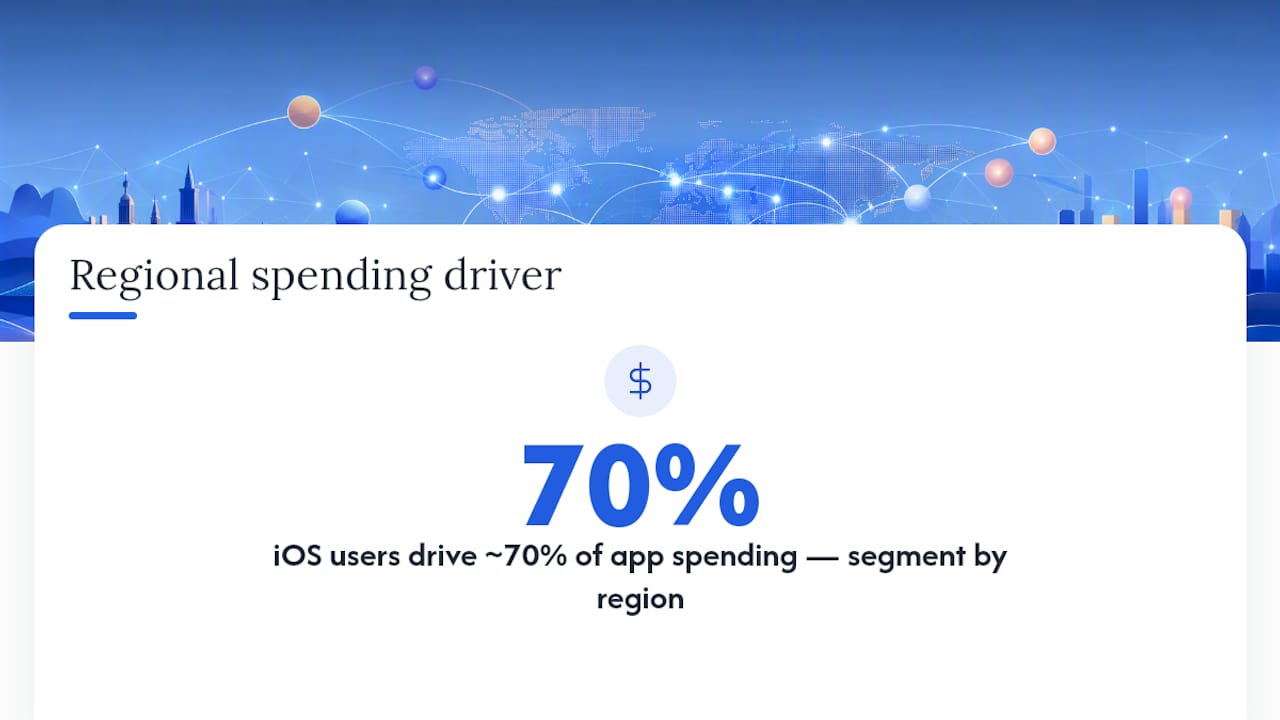
iOS users generate the disproportionate share of consumer spending globally, close to 70% by Business of Apps’ count, which skews category revenue heavily toward markets with high iPhone penetration: the United States, Japan, the United Kingdom, and much of Western Europe. Android dominates downloads in many emerging markets, but per-user spend there often runs a fraction of iOS levels.
Demographics compound this. Younger users in gaming-heavy markets drive IAP volume through frequent small purchases, while older, higher-income users in productivity and health categories drive subscription revenue through fewer, larger recurring payments. A fitness app targeting professionals in a major metro market will see a completely different ARPU profile than the same app marketed broadly across a lower-income region.
The practical takeaway: never set a single global price or a single global revenue target. Segment your benchmarking by region before you compare yourself against category averages, and expect your best-performing market to outearn your weakest by several multiples, not by a small margin.
How Did COVID-19 and Other Shocks Reshape Category Revenue?
The pandemic produced the clearest natural experiment app category revenue has ever seen. Productivity, communication, and education apps saw sudden, sustained demand spikes as remote work and remote learning became the default rather than optional. Fitness apps saw a similar surge as gyms closed, pushing users toward app-based workout subscriptions almost overnight.
Entertainment and streaming categories benefited from the same lockdown dynamic, with subscription sign-ups accelerating well beyond pre-pandemic trend lines. Games saw uneven effects: casual and hyper-casual titles gained from bored, homebound users, while some social and dating categories initially dipped before rebounding hard as usage patterns normalized.
The lasting lesson isn’t the spike itself. It’s what happened after: categories that converted pandemic-era trial users into durable subscription habits kept much of that gained revenue. Categories that saw a usage spike without a matching monetization push mostly reverted to pre-pandemic baselines once behavior normalized. Retention discipline during a demand shock determines whether the bump becomes permanent revenue or a temporary blip in your dashboard.
How Do You Optimize Revenue Inside a High-Earning Category?
Landing in a top-grossing category doesn’t guarantee top-grossing results. Revenue concentrates so heavily that the median app in games or entertainment earns a small fraction of what category leaders capture, which means execution inside the category matters more than the category label itself.
For subscription-driven categories, trial length optimization is the single highest-leverage lever available. RevenueCat’s conversion data shows the gap between short and extended trials is large enough to justify testing longer windows even when it feels counterintuitive to delay revenue recognition.
For IAP-driven categories like games, the leverage sits in the first-session experience. Rewarded ad placement and IAP prompts that appear before a user forms any habit convert poorly compared to prompts introduced after a demonstrated moment of value.
Across every category, price testing by region beats a single global price point. A $9.99 subscription might be underpriced in one market and overpriced in another, and category benchmarks won’t tell you which without segmented testing.
Retention deserves more attention than acquisition once you clear initial product market fit. Acquiring users into a leaky funnel just raises your churn bill; fixing the retention curve first makes every subsequent acquisition dollar worth more.
What Are the Biggest Risks in Monetizing Certain Categories?
Every category carries a distinct failure mode, and the risks rarely show up until real revenue is on the line.
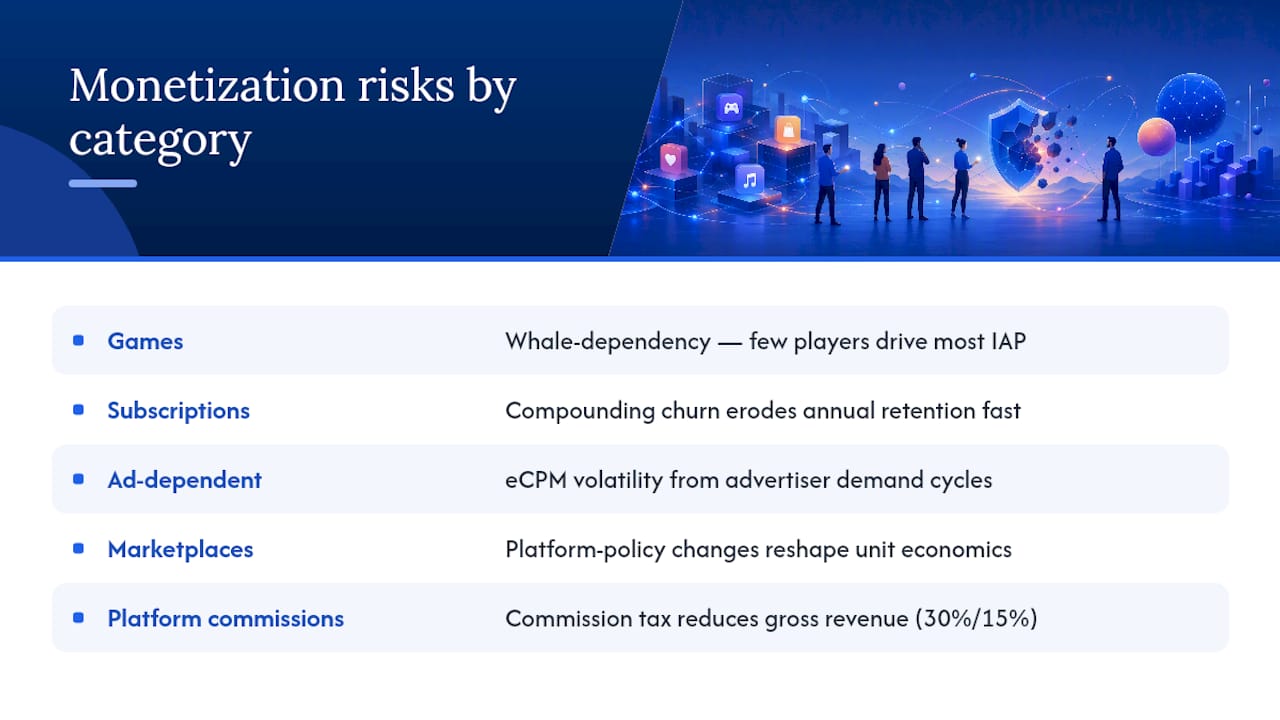
Games face the steepest whale-dependency risk: a small percentage of high-spending players often generate the majority of IAP revenue, which means losing a handful of top spenders can crater a monthly total that looked healthy on paper.
Subscription categories face churn risk that compounds quietly. A 5% monthly churn rate sounds tolerable until you run the math on annual retention, and productivity or fitness apps with weak habit formation frequently underestimate how fast that erosion compounds.
Ad-dependent categories face eCPM volatility tied to advertiser demand cycles, meaning a casual game’s ad revenue can swing significantly between quarters for reasons entirely outside the developer’s control.
Marketplace and transactional apps carry platform-policy risk: commission structure changes or in-app purchase rule updates can reshape unit economics with little warning.
And every category, without exception, faces the platform-commission tax. Whether you fall under Apple’s standard 30% rate or qualify for the 15% Small Business rate, that fee comes off the top before you see a dollar, and models built on gross revenue assumptions consistently overstate what actually lands in the bank.
Priorities Worth Setting Before You Build Next Quarter’s Targets
Retention beats acquisition for recurring revenue categories. A subscription app that fixes churn earns more from its existing base than one that keeps buying new users into the same leaky funnel.
Extend trial windows if you’re subscription-first. The conversion gap between short and long trials is wide enough that most teams testing it find the extra patience pays for itself.
Test regional pricing wherever your category shows real geographic revenue variance, which is most categories. A flat global price is usually leaving money on the table in your strongest markets and pricing out your weakest ones entirely.
— Sergey
Put These Category Benchmarks to Work With Apppricer
Category averages tell you where the opportunity sits. They don’t tell you what your specific competitors are charging, which subscription tiers actually convert in your niche, or how your pricing compares to the five apps fighting you for the same download. That’s the gap Apppricer closes.
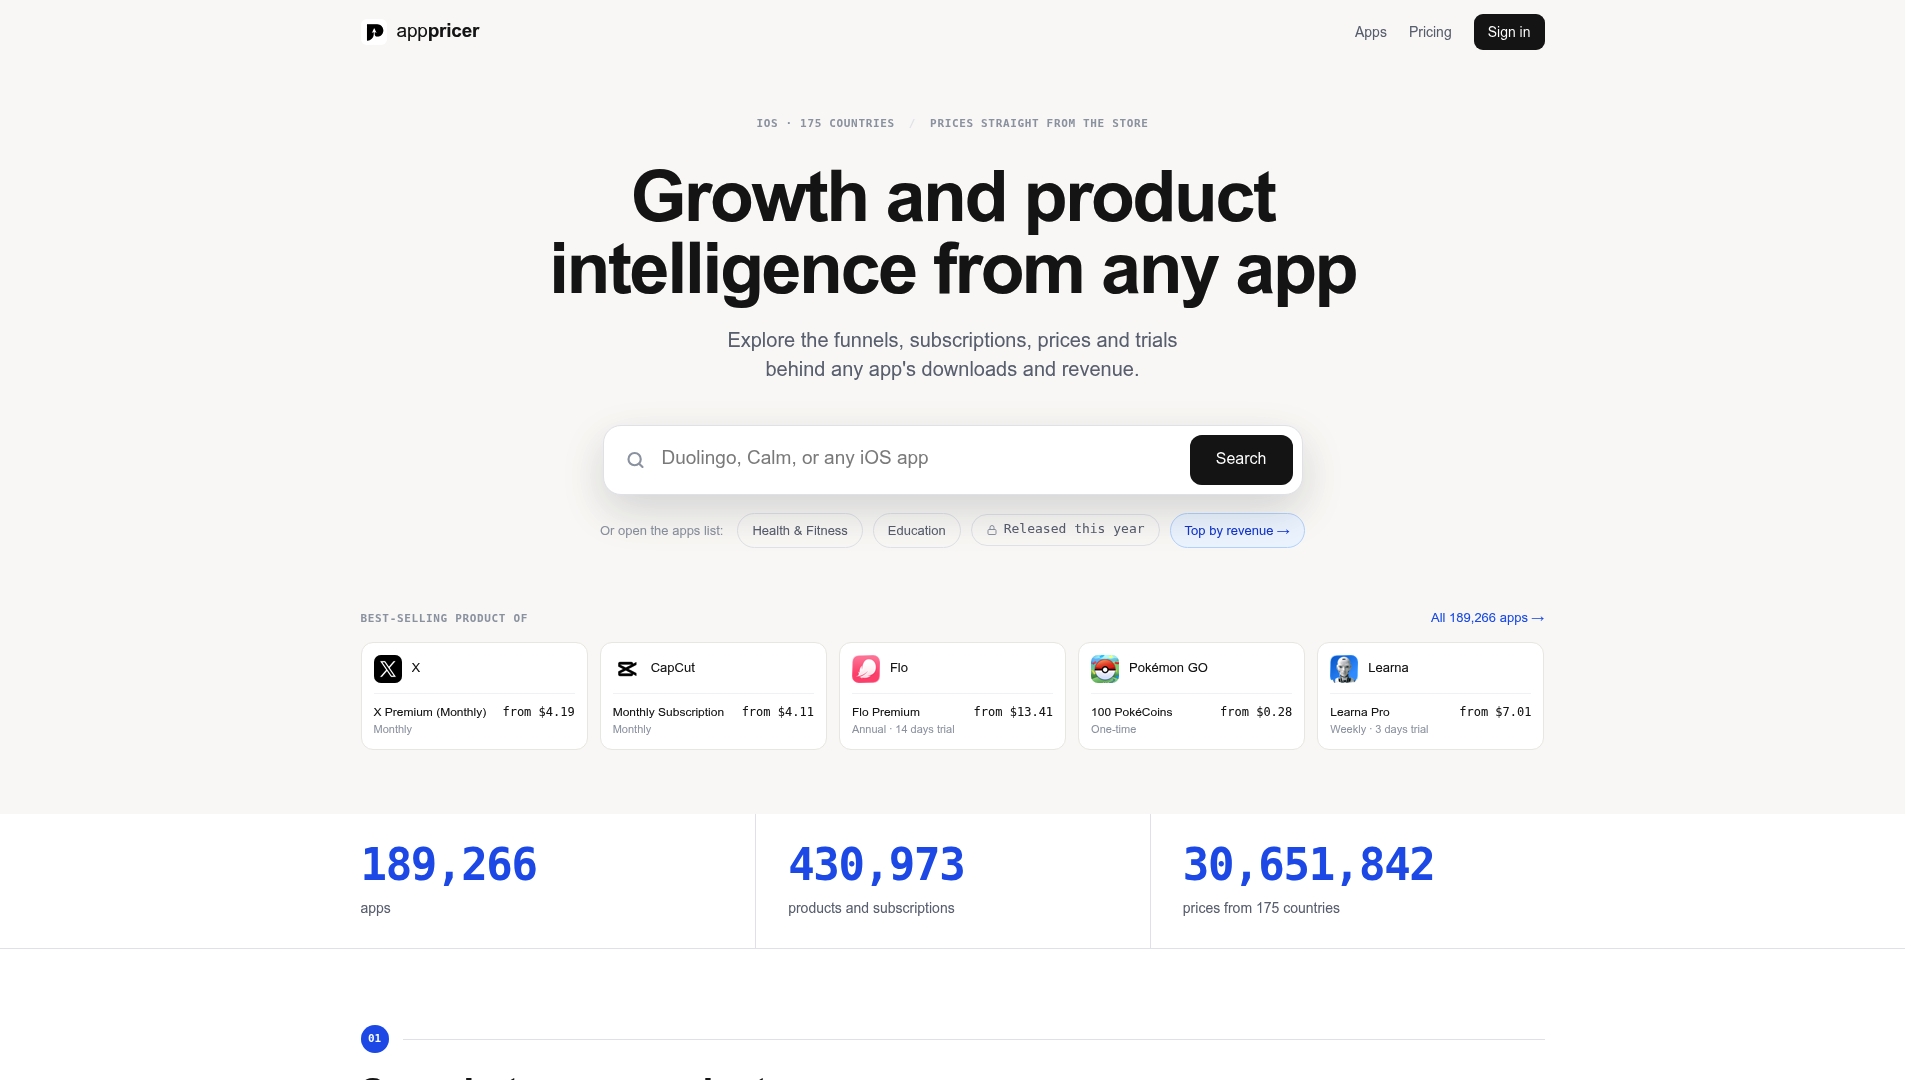
Apppricer aggregates real app pricing, subscription structures, and revenue signals across 175 countries, pulled directly from live store data rather than survey estimates. Instead of guessing whether your $9.99 subscription is competitive, you see what category leaders in your exact niche charge, in your exact target markets, right now. Growth teams use such tools to set ARPU targets grounded in competitor performance, then run pricing experiments against benchmarks rather than category-wide averages that may overlook important details.
If you’re setting next quarter’s revenue targets, start by checking what your category’s top performers charge before you lock in a price point.
Sources
- How to Monetize an App: 9 Revenue Models (2026)
- App Revenue Data (2026) - Business of Apps
- Highest grossing mobile app categories worldwide in 2025
FAQ
What Are the Most Profitable App Categories?
Games capture the largest total revenue, close to 48.8% of the market, but subscription-driven categories like productivity, fitness, and dating typically post higher per-user revenue (ARPU) despite smaller total dollar figures.
How Much Is an App With 100,000 Users Worth?
It depends entirely on category and conversion rate rather than user count alone.
How Much Do Top 200 Apps Make Per Day?
Public category data doesn’t break out daily figures for a specific number of top apps, but revenue concentrates heavily at the top: a small number of leading apps in games and entertainment account for a disproportionate share of the $150.5 billion generated across the market in 2025.
How Much Revenue Can an App Generate?
Revenue potential spans from effectively zero to hundreds of millions annually, with the outcome shaped almost entirely by category choice, monetization model fit, and retention execution rather than by any fixed ceiling. Tools like Apppricer help estimate a realistic range by benchmarking against real competitor pricing and subscription data in your specific niche.