
Chartistic - Charting App
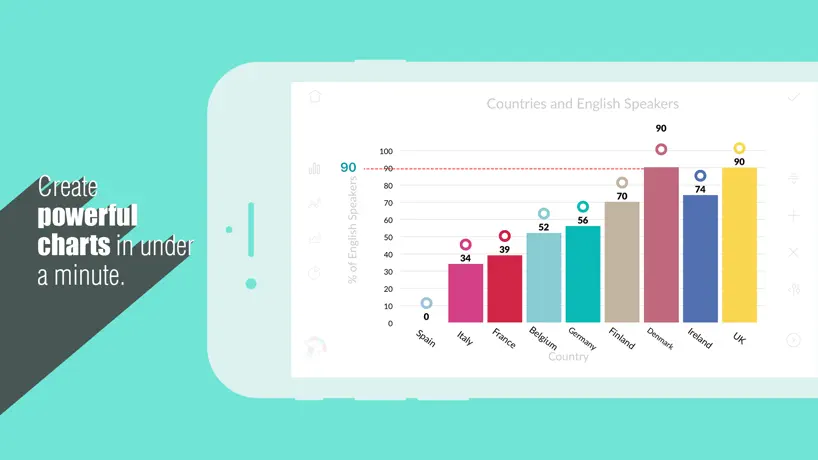
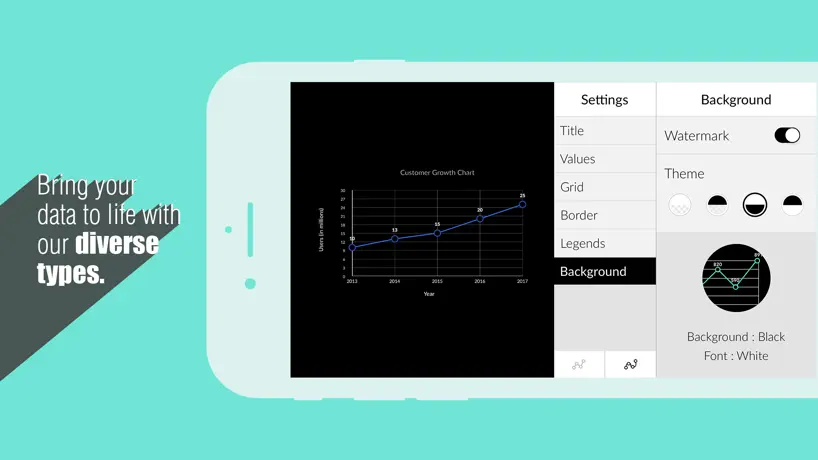
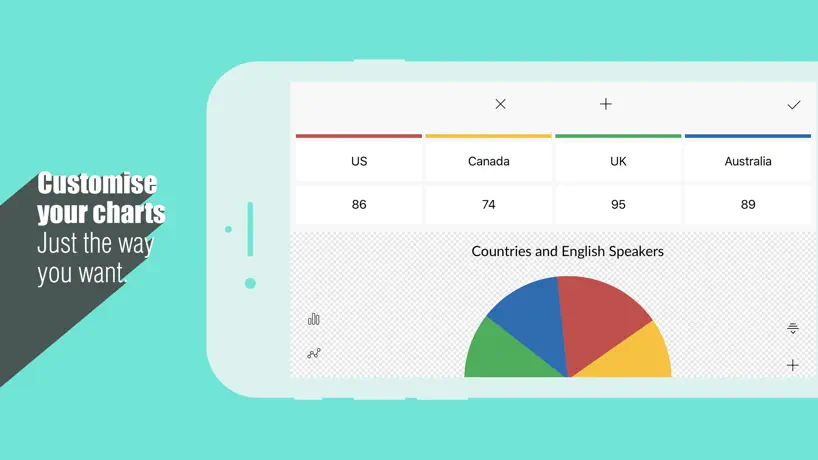
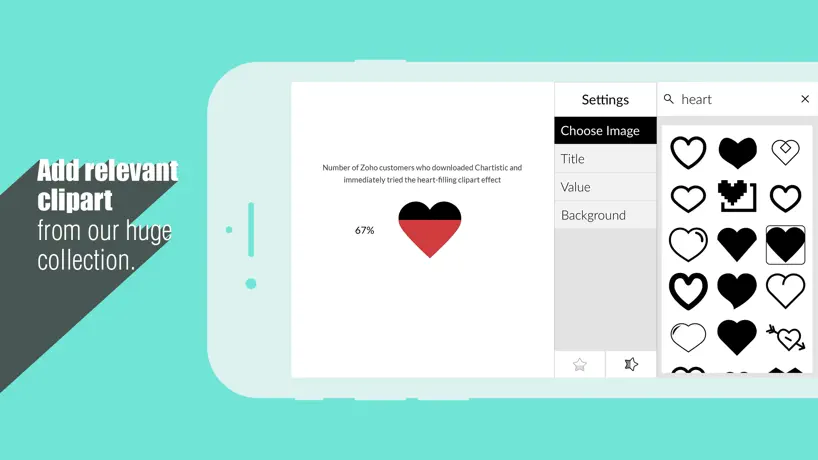
How much does Chartistic - Charting App cost?
Prices are current as of 12 Nov 2026.
Chartistic - Charting App has no in-app products on record in the United States.
10+ alternatives to Chartistic - Charting App
| Chartistic - Charting App |   Charty for Shortcuts |   Chart Builder Graph Maker | 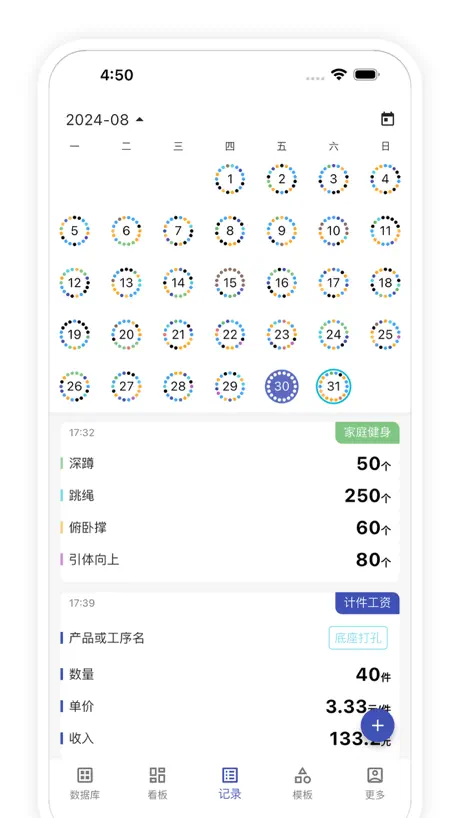  Tangrid: personal database | 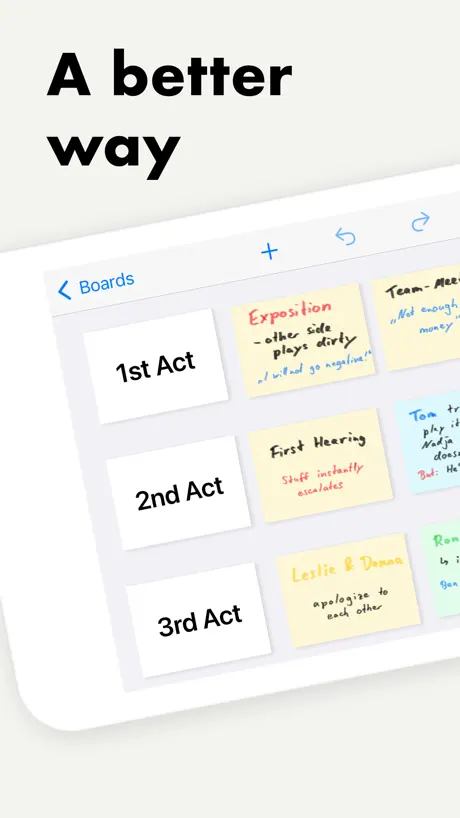  CardBeat: Story Plot Corkboard | 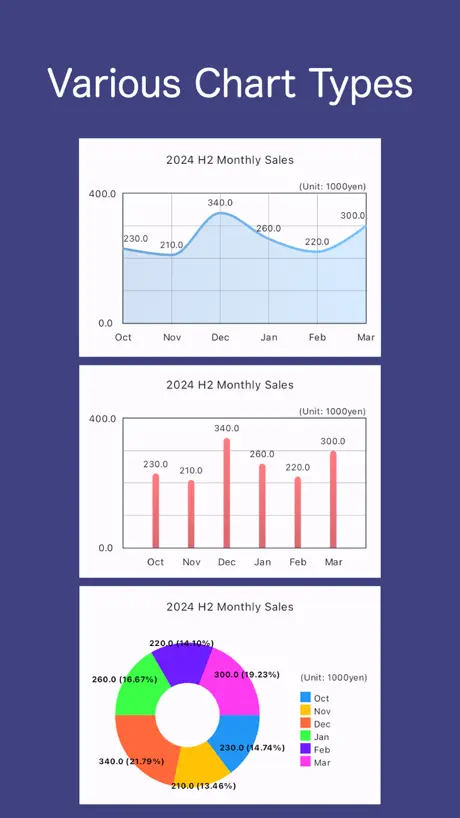  Graph Maker - easy combo chart |   Xchart-Quick Charts+AI Insight |   Graph |   Charts IQ: Chart & Graph Maker |   My Graph ( Chart ) |   ChartLre - Create Charts | |
|---|---|---|---|---|---|---|---|---|---|---|---|
| Rating / 5 | 4.5 | 4.6 | 4.5 | 4.8 | 4.2 | 4.2 | 3.9 | 2.9 | 3.8 | 4.0 | 4.3 |
| Reviews | 1.6K | 924 | 694 | 274 | 131 | 131 | 78 | 55 | 43 | 33 | 3 |
| Released | 2016 | 2020 | 2023 | 2023 | 2020 | 2023 | 2021 | 2010 | 2023 | 2014 | 2018 |
| Monthly price | — | $1.99 | — | — | — | $1.99 | — | — | — | — | — |
| One-time price | — | $4.99 | — | $8.99 | $19.99 | — | — | — | — | — | — |
The going rate for each plan in United States, in its own currency, shaded from the cheapest price on the row to the dearest. Plans fewer than four in ten of the priced apps sell are left out.
Chartistic - Charting App reviews
4.5 out of 5, based on 1,597 reviews.
What people like
- Totally free with no annoying ads
- Super simple and easy to use
- Makes pretty graphs without the fuss
What they complain about
- Stuck at only twelve data points
- Crashes and loses your saved work
- Cannot change bar or line colors
NO ADS AND FREEEEE
This app is simple and a bit limited, but completely FREE! No ads or paywalls!! I lovelovelove apps that are free and don’t have ads or bug you about subscribing!! This app is so amazing!!
Inaccurate
It keeps changing my numbers after I save them.
Ideas
There needs to be a feature to move the bars into different places. I don’t want to be changing the values, moving them into different places manually. I should be able to move them by dragging the bars to different lop locations. also the max value needs to be updated. Make these changes and I’ll give it 5 stars.
false information
doesn’t let you title anything more then ten characters, and writes any percentage less then 5 as a 0
Background picture
Hi there, I’ve just downloaded the app and so far I like it, just one question is it possible for me to change the background to one of my choice as I am using it for a kids football team and want there club logo as background
Kinda boring now
I think there should be a major update to add more graphs, maybe even weir minute timers, and higher the limit of hiw many numbers there are.
Sandy
One Because You only Just go at 100 but why can they just go number higher because when I try it didn’t let me get to 5555 it just said that you can lower like there bad doing pie chart
Way Too Limited‼️
I love this app, I use it all the time but I desperately need the number of inputs to be increased. I need to chart more data over longer periods of time and the current app only allows 12 slots. I need to be able to input dozens, there’s no reason why this app shouldn’t easily allow more than 100 places of information.
Pretty good but not great
The graph was pretty easy to make, but only certain limit of characters made it hard. You can’t choose the colors of your graphs either which is annoying. Do as you wish, but I would recommend another app.
More than 1 line graph?
Am I missing something or is it possible for only one line graph to be drawn at one time? It would be incredibly helpful to put multiple line graphs on the same chart? Otherwise what’s the point... please & thank you.
Amazing but small disadvantage
I love this chart app. You can even create image charts! Unfortunately, it doesn’t support negative numbers. Maybe you should make an update that supports negatives? Please and thank you. Edit: I would really like it if you would add customizable colors instead of the colors given. Examples: RGB, HEX, CMYK, et cetera.
Nearly useless
You can only have 12 data points - I can just visualize that in my head without a chart.
Almost great
The app is really great but you can’t put multiple Y values in which is frustrating for when I have multiple values for one percentage
Not User frienfly
Difficult/unyielding design
Issues
Not saving recent data
EASY AND USER FRIENDLY!
This app honestly saved as an artist I can appreciate how easy it is to navigate compared to harder platforms like excel and the colors are just so cute! THANKYOU DEVELOPERS!! :))
Seriously?
The maximum value is only 10,000! That's ridiculous! I'm trying to show a disparity in wealth. I need billions!
Good app but had a annoying bug
I have experienced a bug when entering data which occurs when i enter and amount that is under the minimum. This bug activates a pop up that says “The value entered is lower than the minimum value.” This pop up comes back every time i close it and forces me to restart the app which makes me lose my data please fix this and it would be a 5 star app it is very easy to use and I love it.
Seemed like a good app...but
After trying it for a few minutes, I realised there is a very short character limit on the labels for pie charts. Not to mention labelling didn’t seem immediately intuitive. Anyway, this wasn’t suitable for my needs because of that - so I uninstalled.
Good start but needs some improvements
Looks pretty and is fairly easy to manipulate the graph but it does have a problem with sometimes changing the number you enter to plot (it’s changing 12.70 to 12.69 and 12.03 to 12.02 when you save it). You can change the background color of the graph but you can’t change the color of the line.
Perfect
No flaws
Disappointed and showed promise!
This seemed exactly what I needed until I realised you can only have 12 entries on the X axis which is no good for my needs. Would happily pay for the app if you could increase the number of points on this axis as apart from that is just what I needed. Short sighted and limited by the designers.
5 star if it had Histogram
Noice 👌
Line graph pain
I just wanted a simple line graph to track number of increased covid cases in my small country town. I wanted x-axis numbers from 1-100, not up in the thousands. I couldn’t change the x axis numbers. I also found it difficult to navigate in general.
Okay but not greay
Was easy to use and very functional for my needs. Then one day i went to open the app to change some stuff on a graph and it kept telling me to make a new chart. I whent to find my graphs and nothing showed up... it had deleted them all
Perfect
Finally a Graph app that you can totally control all aspects of your data. Thanks
Great app
Not being able to select your own colors is a big downside, other wise great app.
Good
Nice but can you add a spline grAph where you can compare other things
Increase data points
Only 12? Come on.
Easy and quick
Quick to put together a graph. Definitely need more than one data set on a line graph though.
Amazing but could use improvement
I don’t usually review apps but I absolutely love how simple and easy this app is to create charts. It lets you customize just about everything.. except for one thing which is my only complaint. When dealing with smaller numbers (like decimals) this app doesn’t allow you to adjust or change how many decimal places you can have for the data. So for example, if the figures are 0.0004%, 0.0001%, 0.0005% and 0.0021% it will translate all of them as 0 since it only goes two decimal places over (0.xx for example). If they could change this to allow us to edit how many decimal places are displayed it’d be perfect!
Likes and dislikes
I like that it makes making graphs really easy But, I dislike the fact that it gets stuck from time to time But aside from that there is no reason not to get it.Also it might be useful if you added a function that made it possible to analyse data and run numbers
Great but...
The app is great but i wish i could be more bars than just 11 and i want to be able to type more than 10 letters
Good for small graphs, bad for real data keeping
All I wanted was to make a line graph to track my scores in a video game over time. Unfortunately, I couldn’t make the y-axis go to a value above 10k (I needed it to go up to 50k) and the x-axis wouldn’t go on long enough anyway. It’s a sleek app if you want to make a small graph, but it’s useless for real data keeping.
Pretty Good
I really like the aesthetic and ease of use. However, disappointed that you can’t use decimals. There’s a decimal toggle but you still can’t add decimals to any values or on the axis.
Excelente
Muy buena app y fácil
Values don’t go high enough.
Why are the values limited?
Chart length
Is the chart limited to entries that fit just on one page or is there a way to scroll?
Do not recommend.
Too many glitches, crashes often, interface is clunky, controls are obtuse, does not save automatically. Could be vastly improved with an update.
Unfortunate limited space
The app looks good and works well, but doesn’t let you go past 12 values on the x-axis. What’s the point?
A Simple Tool with Great Functionality
A lot of the graphing tools on the app store make the experience too complicated for no reason and no better results. This manages to keep it simple while still allowing you to create a good-looking graph. 5/5 thank you
Not big enough
Gave this app a try. First you have to make sure to save often or you will loose progress on your graph. The other problem is that the Y-axis only allows for a dozen values. Plus as other have said, the X-axis only goes to 1000. Great idea but it needs more ability to expand the chart.
Good
Good app, would love ability to reduce decimals from two digits to one.
Limited Use
This is a great little app, but its usefulness is severely limited by only being able to enter 12 data entries. Once 12 items have been entered the + icon to add more data greys out, leaving just the delete x icon.
Very good but needs some work
This app is very good, but it needs a little bit of work, like for say more value when making line charts or make a two line chart, or more value, and stuff, so all and all this is very well made but it could use more work :)
Great App!
Great app but we need a feature that adds more lines to a line graph!!
Cmon
Spent a half hour inputting data and it crashes unsaved. How hard is it to auto save in 2020...
Good But Needs Some Improvements
Overall this app is really good and I would recommend it but.... For the labels of the chart bars can you let the maximum amount of letters in it more than 10 or just infinite? I was ranking countries life expectancies the other day and some countries you can’t write their name completely because of the max number of each bar label is 10. So if you fix this in the future I would give this app a 5 star.
Unable to edit axis
I was unable to edit x or y axis titles. In the setting it had display legend, but you can only enter one set of data points per chart. Two stars because unable to share chart at the moment as it is meaningless without x and y axis titles, but showing promise. Unable to enter feedback. There were two fields - email and feedback. Unclear what to enter in email field as not automatically completed with their email address. Completed my own email address but then unable to enter the feedback field to type in my feedback comments.
It’s alright
Loved everything about it besides the fact that you can’t edit the colors of the bar graph bars when you need certain colors for each one. Other than that it’s a good app.
Chartistic - Charting App FAQ
- Is Chartistic - Charting App free?
- Yes. The app is free, in all 175 countries it sells in, and it sells nothing inside it.
- Does Chartistic - Charting App have a free trial?
- No. None of its offers (US) come with a free trial.
- What are the best alternatives to Chartistic - Charting App?
- Charty for Shortcuts (4.6 from 924 reviews, premium from $0.99), Chart Builder Graph Maker (4.5 from 694 reviews) and Tangrid: personal database (4.8 from 274 reviews, premium from $1.99).
Chartistic - Charting App download
Last updated 1 year ago.
Chartistic - Charting App sells in 175 countries. It was released 10 years and 1 month ago, on 4 Oct 2016. It holds a 4.5 rating from 1,597 reviews.
Supports 2 languages: English, Chinese.
How much does Chartistic - Charting App make?
Third-party estimates for the last 30 days, worldwide — not the store's own figures, which Apple publishes for nobody.